NH ProfTeaser
If you want to learn more, come to my Advanced NHibernate talk tomorrow.
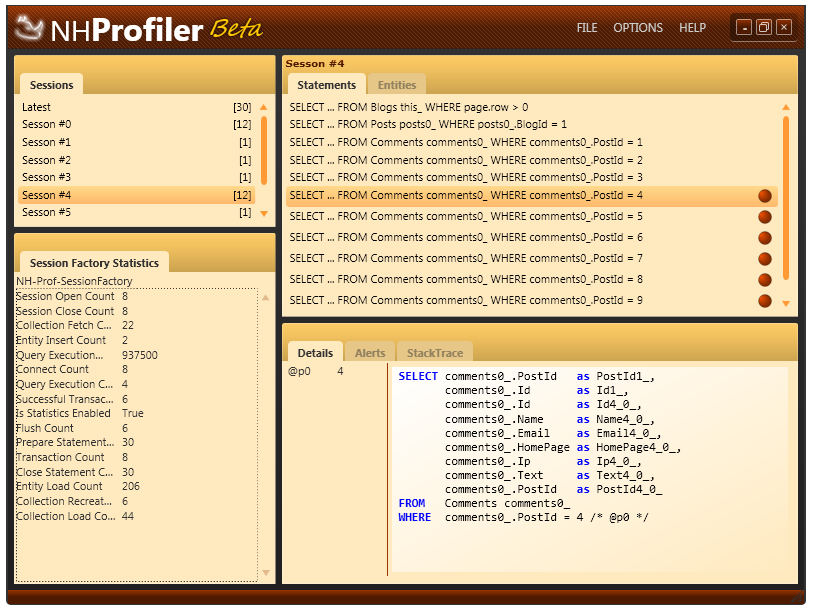
This time, this is literally a snapshot of the application as it is running, and it is showing most of the surface level functionality that exists at the moment in the application.
Oh, and all the kudos for the look and feel goes to Christopher and Rob, who make it looks so easy.
More posts in "NH Prof" series:
- (09 Dec 2010) Alert on bad ‘like’ query
- (10 Dec 2009) Filter static files
- (16 Nov 2009) Exporting Reports
- (08 Oct 2009) NHibernate Search Integration
- (19 Aug 2009) Multiple Session Factory Support
- (07 Aug 2009) Diffing Sessions
- (06 Aug 2009) Capturing DDL
- (05 Aug 2009) Detect Cross Thread Session Usage
- (22 May 2009) Detecting 2nd cache collection loads
- (15 May 2009) Error Detection
- (12 May 2009) Queries by Url
- (04 Feb 2009) View Query Results
- (18 Jan 2009) Superfluous <many-to-one> update
- (18 Jan 2009) URL tracking
- (10 Jan 2009) Detecting distributed transactions (System.Transactions)
- (06 Jan 2009) The Query Cache
- (05 Jan 2009) Query Duration
- (24 Dec 2008) Unbounded result sets
- (24 Dec 2008) Row Counts


Comments
really, really great !
The main menu on the right side is not very intuitive, imho.
Please record the session!
You can even charge for it..
Coming along very nicely Oren, The Ubuntu-like theme looks very attractive and the usability looks very intuitive - it looks like you have access to a good UI Designer.
Ayende,
I guess there is no need to remind you in email to show the parameter replacements :-)
Good visiting with you yesterday.
craig
Looking great!
I suppose statistic has to be turned on for this to work? Hopefully I'm wrong here (I haven't made any measurements myself), but I thought this was not recommended in live enviroments because of the over head? In other words - this profiler is not supposed to be used on live system running in "normal mode"?
Why so many queries?
Select ... from Blogs where page.Row > 0;
Select ... from Posts where Posts.BlogID in (1,2,3,4,5);
Select ... from Comments where Comments.PostID in (1,2,3,4,5,6,7,8,9);
Roger,
Stats are not really problematic from perf perspective.
But if you are not using them, there is not point in having them on.
The profiler has several modes, one of them is for online profiling, in which I assume that perf isn't critical issue, and I can spend more time getting more data.
The second mode is offline mode, in which we generate a file which will be later read by the profiler as leasure.
Peter,
I am showing SELECT N+1 issue.
The point in the picture is to show how you can recognize that
Oh I see. I am just used to my OPF optimising stuff like this for me so not really used to seeing it.
Pete
Looks very promising! Keep up good work Oren!
It looks really nice
Ayende
I haven't followed much your project so bear with me.
Are you planning on adding the ability to earmark the calling code (.net) responsible for executing inefficient queries so that it's easy to see where different fetching strategies should be used ?
PS: it was nice to see you at the London .Net beers and your enthousiasm with DSLs :)
Daniel,
I don't only plan on doing that, it is already there. You can see the stack trace tab which contains that.
Is that using Caliburn?
What I wonder is: how are you attaching the profiler to a live application? The reason is that once you are able to do that, you're able to see data which might not be for your eyes. I.o.w. how are you going to offer security for this?
Hmm... if any data that we shouldn't be seeing then it should be encrypted in the first place.
@Arild
Yes. But, only in a minor way in the current version. Essentially, the main Menu uses Actions to execute methods on the MenuModel. The rest of the UI, is accomplished entirely through basic databinding to a set of rich presentation model classes.
Great job guys!
Comment preview