Oren Eini

CEO of RavenDB

a NoSQL Open Source Document Database

Get in touch with me:

oren@ravendb.net +972 52-548-6969

Posts: 7,520
|
Comments: 51,141
Privacy Policy · Terms
filter by tags archive
time to read 5 min | 849 words

Finding the appropriate image for this post was hard, you try searching for “racy pictures” in Google Image Search, but you might not want to do it from work Smile.

Anyway, today at lunch we had a discussion about abstractions and at what level you should be working. The talk centered about the difference between working in low level C and working with a high level framework like C# and the relative productivity associated with it.

At one point the following argument was raised: “Well, consider the fact that you never need to implement List, for example”. To which my reaction was: “I did just that last week”.

Now, to forestall the nitpickers, pretty much any C developer will have an existing library of common data structures already in place, I know. And no, you shouldn’t be implementing basic data structures unless you have a really good reason.

In my case, I think I did. The issue is very simple. I need to have a collection of items that are safe for multi threaded reads, but they are mostly only ever accessed from a single thread, and are only ever modified by a single thread. Oh, and they are also extremely performance sensitive.

The reason we started looking into replacing them is that the concurrent data structures that we were using (ConcurrentDictionary & ConcurrentStack, in those cases) were too expensive. And a large part of that was because they gave us a lot more than what we actually needed (fully concurrent access).

So, how do we build a simple list that allow for the following:

  • Only one thread can write.
  • Multiple threads can read.
  • No synchronization on either end.
  • Stale reads allowed.

The key part here is the fact that we allow stale reads.

Here is the concrete scenario, we need to track all active transactions. A transaction is single threaded, but we allow thread hopping (because of async). So we define:

image

And then we have:

image

DynamicArray is just a holder for an array of Nodes. Whenever we need to add an item to the active transactions, we’ll get the local thread value, and do a linear search through the array. If we find a node that has a null Transaction value, we’ll use it. Otherwise, we’ll add a new Node value to the end of the array. If we run out of room in the array, we’ll double the array size.  All pretty standard stuff, so far. Removing a value from the array is also simple, all you need to do is to null the Transaction field on the relevant node.

Why all of this?

Well, only a single thread can ever register a transaction for a particular DynamicArray instance. That means that we don’t have to worry about concurrency here. However, we do need to worry about transactions that need to remove themselves from the list from other threads. That is why we don’t have any concurrency control here. Instead, removing the transaction is done by setting the node’s Transaction field to null. Since only the owning transaction can do that, this is safe.

Other threads, however, need to read this information. They do that by scanning through all the thread values, and then accessing the DynamicArray directly. Now, that means that we need to be safe for concurrent reading. This is done by having the array more or less static on most scenarios. After it get full enough, it will never grow again, and the values will remain there, so effectively other threads will be reading an array of Nodes. We do need to be careful when we expand the array to give more room. We do this by first creating the new array, copying the values to the new array, and only then setting it in the threaded instance.

This way, concurrent code may either see the old array or the new one, but never need to traverse both. And when traversing, it goes through the nodes and check their Transaction value.

Remember that the Transaction is only being set from the original thread, but can be reset from another thread if the transaction moved between threads. We don’t really care, the way it works, we read the node’s transaction field, and then check its value (once we have a stable reference). The idea is that we don’t worry about data races. The worst that can happen is that we’ll see an older view of the data, which is perfectly fine for our purposes.

This is pretty complex, but the code itself is simple enough, and the performance benefit justify it several times over.

time to read 2 min | 269 words

Some of the performance work that I have been doing recently was complex, and then, some of it isn’t:

image

And its implementation:

image

And the optimized version:

image

And the result?

image

The really interesting thing is that we have an improvement that is about 3 times more than we would expect. Why is that?

We can see that we eliminated the ResouceName call, and saved all of that cost, but we have much lower cost overall, where did that come from?

This is something that we saw over and over again. The obvious answer is that we now do less allocations, so we have less GC work to do, which is true as far as it goes, but it is also true that when we are even slightly faster, things start to align more closely, and we get a chain reaction (slightly less work means more time process the actual requests, so we can get more done in less).

time to read 1 min | 112 words

I’m very proud to announce that RavenDB 3.5 is out and about, feeling quite awesome about itself.

image

Here is some of our team in Las Vegas celebrating the release:

image

You can find the go read the full features highlights page, or you can download it or just start playing with it directly.

This release represent about 3 years of effort and over three thousands commits.

This release makes me very happy.

time to read 2 min | 239 words

This series is no longer appropriately named, but we’ll go with that for the sake of grouping everything together.

So far we have seen how we start with a fixed benchmark, and we use a profiler to narrow down all sort of hotspots. However, we do that in a pretty strange way. Consider were we started:

Now consider this series’ name. Why are we even looking at OpenReadTransaction in the first place? There is a big giant hotspot in GetDocumentsById that we can start with.

Even a small change there is likely to generate a lot more results for our benchmark than eliminating everything else entirely. So why focus on those first?

Put simply, this isn’t just about this particular benchmark. We focused on everything else because those are costs that are shared across the board. Not only for the “read random documents” benchmark but for pretty much anything else in RavenDB.

By reducing those costs, we are enabling ourselves to get much better performance overall. And we’ll get to the actual meat of this benchmark late, when it takes the bulk of the work.

Look at the relative costs here. We moved from 60% of the request being spent there to over 80% being spent there. (Don’t look at the actual number, different machines, load and timing are responsible for those).

Now any work that we do here will have much greater impact.

time to read 3 min | 469 words

As an aside, I wonder how much stuff will break because the title of this post has in it.

The topic of this post is the following profiler output. GetSliceFromKey takes over 6% of our performance, or about 24.5 seconds out of the total run. That kinda sucks.

image

What is the purpose of this function? Well, RavenDB’s document ids are case insensitive, so we need to convert the key to lower case and then do a search on our internal index. That has quite a big cost associated with it.

And yes, we are aware of the pain. Luckily, we are already working with highly optimized codebase, so we aren’t seeing this function dominate our costs, but still…

Here is the breakdown of this code:

image

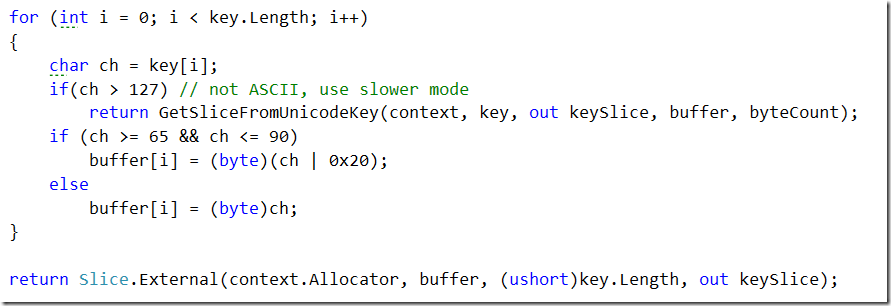
As you can see, over 60% of this function is spent in just converting to lower case, which sucks. Now, we have some additional knowledge about this function. For the vast majority of cases, we know that this function will handle only ASCII characters, and that Unicode document ids are possible, but relatively rare. We can utilize this knowledge to optimize this method. Here is what this will look like, in code:

image

Basically, we scan through the string, and if there is a character whose value is over 127 we fall to the slower method (slower being relative, that is still a string conversion in less than 25 μs).

Then we just find if a character is in the upper case range and convert it to lower case (ASCII bit analysis is funny, it was intentionally designed to be used with bit masking, and all sort of tricks are possible there) and store it in the buffer, or just store the original value.

The result?

image

This method went from taking 5.89% to taking just 0.6%, and we saved over 22 seconds(!) in the run. Again, this is under the profiler, and the code is heavily multi threaded. In practice, this means that the run took 3 seconds less.

Either way, we are still doing pretty good, and we don’t have that pile of poo, so I we’re good.

time to read 2 min | 364 words

We focused on opening the transaction, but we also have the context management to deal with, in this case, we have:image

And you can see that it cost us over 11.5% of the total request time. When we started this optimization phase, by the way, it took about 14% of the request time, so along the way our previous optimizations has also helped us to reduce it from 42 μs to just 35 μs.

Drilling into this, it become clear what is going on:

image

image

The problem is that on each context release we will dispose the ByteStringContext, and on each operation allocation we’ll create a new one. That was done as part of performance work aimed at reducing memory utilization, and it looks like we were too aggressive there. We do want to keep those ByteStringContext around if we are going to immediately use them, after all.

I changed it so the actual disposal will only happen when the context is using fragmented memory, and the results were nice.

image

This is a much nicer profiler output to look at, to be frank. Overall, we took the random reads scenario and moved it from million reads in 342 seconds (under the profiler) to 264 seconds (under the profiler). Note that those times are cumulative, since we run that in multiple threads, the actual clock time for this (in the profiler) is just over a minute.

And that just leave us with the big silent doozy of GetDocumentsById, which now takes a whooping 77% of the request time.

time to read 7 min | 1268 words

As in the last post, I’m focusing on reducing the startup time for transactions. In the last post, we focused on structural changes (removing Linq usage, avoiding O(N^2) operations) and we were able to reduce our cost by close to 50%.

As a reminder, this is what we started with:

And this is where we stopped on the last post:

Now, I can see that we spend quite a bit of time in the AddifNotPresent method of the HashSet. Since we previously removed any calls to write only transactional state, this means that we have something in the transaction that uses a HashSet and in this scenario, adds just one item to it. Inspecting the code showed us that this was the PagerStates variables.

Transactions need to hold the PagerState so they can ensure that the pagers know when the transaction starts and ends. And we do that by calling AddRef / Release on that at the appropriate times. The nice thing about this is that we don’t actually care if we hold the same PagerState multiple times. As long as we called the same number of AddRef / Release, we are good. Therefor, we can just drop the HashSet in favor of a regular list, which gives us:

image

So that is about a second and a half we just saved in this benchmark.But note that we still spend quite a bit of time on the List.Add method, looking deeper into this, we can see that all of this time is spent here:

image

So the first Add() requires an allocation, which is expensive.

I decided to benchmark two different approaches to solving this. The first is to just define an initial capacity of 2, which should be enough to cover most common scenarios. This resulted in the following:

image

So specifying the capacity upfront had a pretty major impact on our performance, dropping it by another full second. The next thing I decided to try was to see if a linked list would be even better. This is typically very small, and the only iteration we do on it is during disposal, anyway (and it is very common to have just one or two of those).

That said, I’m not sure that we can beat the List performance when we have specified the size upfront. A LinkedList.Add() requires allocation, after all, and a List.Add just sets a value.

image

So… nope, we won’t be using this optimization.

Now, let us focus back on the real heavy weights in this scenario. The GetPageStatesOfallScratches and GetSnapshots. Together they take about 36% of the total cost of this scenario, and that is just stupidly expensive.  Here we can utilize our knowledge of the code and realize that those values can only ever be changed by a write transaction, and they are never changed . That gives us an excellent opportunity to do some caching.

Here is what this looks like when we move the responsibility of creating the pager states of all scratches to the write transaction:

image

Now let us do the same for GetSnapShots()… which give us this:

image

As a reminder, LowLevelTransaction.ctor started out with 36.3 seconds in this benchmark, now we are talking about 6.6. So we reduced the performance cost by over 82%.

And the cost of a single such call is down to 7 microsecond under the profiler.

That said, the cost of OpenReadTransaction started out at 48.1 seconds, and we dropped it to 17.6 seconds. So we had a 63% reduction in cost, but it looks like we now have more interesting things to look at than the LowLevelTransaction constructor…

image

The first thing to notice is that EnsurePagerStateReference ends up calling _pagerStates.Add(), and it suffers from the same issue of cost because of it needs to increase the capacity.

image

Increasing the initial capacity has resulted in measurable gain.

image

With that, we can move on to analyze the rest of the costs. We can see that the TryAdd on the ConcurrentDictionary is really expensive*.

* For a given value of really Smile It takes just under 3 microseconds to complete, but that is still a big chunk of what we can do here.

The reason we need this call is that we need to track the active transactions. This is done because we need to know who is the oldest running transaction for MVCC purposes. The easiest thing to do there was to throw that in a concurrency dictionary, but that is expensive for those kind of workloads. I have switch it up with a dedicated class, that allows us to do better optimizations around it.

The design we ended up going with is a bit complex (more after the profiler output), but it gave us this:

image

So we are just over a third of the cost of the concurrent dictionary. And we did that using a dedicated array per thread, so we don’t have contention. The problem is that we can’t just do that, we need to read all of those values, and we might be closing a transaction from a different thread. Because of that, we split the logic up. We have an array per each thread that contains a wrapper class, and we give the transaction access to that wrapper class instance. So when it is disposed, it will clear the value in the wrapper class.

Then we can reuse that instance later in the original thread once the memory write has reached the original thread. And until then, we’ll just have  a stale read on that value and ignore it. It is more complex, and took a bit of time to get right, but the performance justify it.

Current status is that we started at 48.1 seconds for this benchmark, and now we are at 14.7 seconds for the OpenReadTransaction. That is a good day’s work.

time to read 5 min | 849 words

The benchmark in question deals with service 1 million random documents, as fast as possible. In my previous post, I detailed how we were able to reduce the cost of finding the right database to about 1.25% of the cost of the request (down from about 7% – 8%). In this post, we are going to tackle the next problem:

image

So 14% of the request times goes into just opening a transaction?! Well, that make sense, surely that means that there is a lot going on there, some I/O, probably. The fact that we can do that in less than 50 micro seconds is pretty awesome, right?

Not quite, let us look at what is really costing us here.

image

Just look at all of those costs, all of this isn’t stuff that you just have to deal with because there is I/O involved, let us look at the GetPagerStatesOfAllScratches, shall we?

image

I’ll just sit down and cry now, if you don’t mind. Here is what happens when you take this code and remove the Linqness.

image

This is purely a mechanical transformation, we have done nothing to really change things. And here is the result:

image

Just this change reduced the cost of this method call by over 100%! As this is now no longer our top rated functions, we’ll look at the ToList now.

This method is called from here:

image

And here is the implementation:

image

And then we have:

image

image

Well, at least my job is going to be very easy here. The interesting thing is that the Any() call can be removed / moved to DEBUG only. I changed the code to pass the JournalSnapshots into the GetSnapshots, saving us an allocation and all those Any calls. That gave us:

image

So far, we have managed to reduce ten seconds out of the cost of opening a transaction. We have done this not by being smart of doing anything complex. We just looked at the code and fixed the obvious performance problems in it.

Let’s see how far that can take us, shall we?

The next observation I had was that Transaction is actually used for both read and write operations. And that there is quite a bit of state in the Transaction that is only used for writes. However, this is actually a benchmark measuring pure read speed, so why should we be paying all of those costs needlessly? I basically moved all the field initializers to the constructor, and only initialize them if we are using a write transaction. Just to give you some idea, here is what I moved:

image

So those are six non trivial allocations that have been moved from the hot path, and a bunch of memory we won’t need to collect. As for the impact?

image

We are down to about half of our initial cost! And we haven’t really done anything serious yet. This is quite an awesome achievement, but we are not done. In my next post, we’ll actually move to utilizing our knowledge of the code to make more major changes in order to increase overall performance.

time to read 5 min | 938 words

The following benchmark is from a small database containing about 500K documents, doing random load by id. As you can see, I highlighted a problematic area:

image

We spent a lot of time to optimize routing as much as possible, so I was pretty annoyed when I saw a profiler output showing that we spend 7% – 8% of our time handling routing.

Actually, that is a lie. We spent most of our time looking up what database we should be using.

I decided to simplify the code a lot, to get down to the essentials, and this is the hotspot in question:


We can’t really test this in something like Benchmark.NET, because we need to see how it works when using multiple threads and concurrent access. We care more about the overall performance than a single invocation.

So I tested it by spinning 32 threads that would call the class above (initialized with 10 different values) with the following keys:

  • Oren
  • oren
  • oRen

Each of the threads would process as many of those calls as it can in the span of 15 seconds. And we’ll then tally up the result. The code above gives me 89 million calls per second, which is impressive. Except that this is actually able to utilize the GetCaseInsensitiveHash, which is an internal call (written in C++) that is extremely efficient. On the other hand, my string segment code is far slower.

image

On the other hand, if I give up on the OrdinalIgnoreCase, in the code above we get 225 million operations / sec, so there is definitely performance left on the table.

The first attempt was to introduce a bit of smarts, if we have a match by case, we can actually check it and still be faster than the case insensitive version. The code looks like this:

This gave a performance of 76 millions ops / sec when running a mix match, and 205 millions / sec when always using the case matching. That was awesome, but we still missed something. This optimization will kick in only if you actually had an exact case match, but it is very common to miss that. In fact, we noticed that because after we applied this optimization, we created a different benchmark where we got a case mismatch, and had hit the same perf issue.

So the next attempt was to actually learn on the fly. The basic idea is that we still have the two dictionaries, but when we have a miss at the first level, we’ll add the entry to the case sensitive dictionary based on what was searched. In this way, we can learn over time, and then most of the calls would be very fast. Here is the code:

And we get 167 millions ops / second using it.

Moving the code to using a ConcurrentDictionary upped this to 180 millions ops / sec.

And this is the final result of actually implementing this:

image

Cost went down from 29.2 seconds to 6.3 seconds! There is still significant cost here around using the concurrent dictionary, but drilling down shows that we are stuck:

image

This is all high end framework code. But we can do better. Instead of calling the framework, and passing this through multiple chains of calls, we can just compare the memory values directly, like so:

image

And this result in:

image

So we dropped the cost fro 6.3 (29.2 initially!) seconds to 5 seconds.

Although, let us take a deeper look at this, shall we?

image

It looks like the actual costs we have here for finding the data are now dominated by the call to ResourceCache.TryGetValue. A small change there gave us:

image

So we saved over 250 ms in our test run, and a total of 6.36% of our runtime cost.

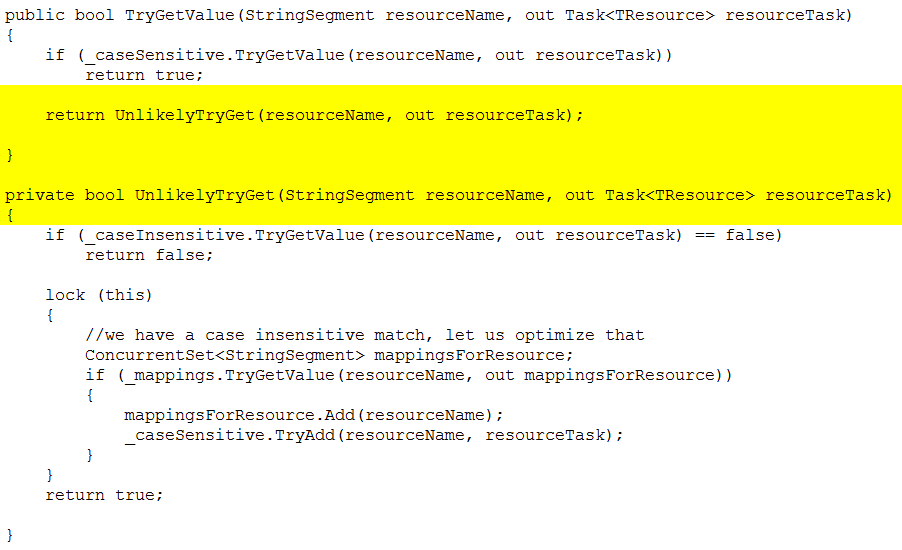
What was the change?

image

The parts outlined in yellow are new. So instead of having a pretty big method, we now have a very small one that does the happy case, and the rest is in the unlikely method that will be called rarely.

time to read 4 min | 615 words

RavenDB is a pretty big project, and it has been around for quite a while. That means that we have run into a lot of strange stuff over the years. In particular, support incidents are something that we track and try to learn from. Today’s post is about one such lesson. We want to be able to track, on a per thread basis, how much memory is in use. Note that when we say that, we talk about unmanaged memory.

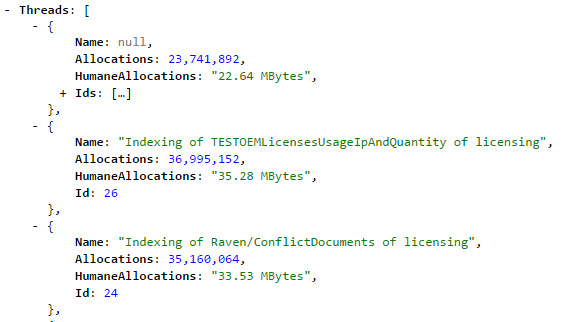
The idea is, once we track it, we can manage it. Here is one such example:

image

Note that this has already paid for itself when it showed us very clearly (and without using special tools), exactly who is allocating too much memory.

Memory allocation / de-allocation is often a big performance problem, and we are trying very hard to not get painted into performance corners. So a lot of our actual memory usage is allocate once, then keep around in the thread for additional use. This turn out to be quite useful. It also means that for the most part, we really don’t have to worry about thread safety. Memory allocations happen in the context of a thread, and are released to the thread once an operation is done.

This gives us high memory locality and it avoids having to take locks to manage memory. Which is great, except that we also have quite a bit of async request processing code. And async request processing code will quite gladly jump threads for you.

So that lead to a situation where you allocate memory in thread #17 at the beginning of the request and it waits for I/O, so when it finally completes, the request finish processing in thread #29. In this case, we keep the memory we go for next usage in the finishing thread. This is based on the observation that we typically see the following patterns:

  • Dedicated threads for tasks, that do no thread hopping, each have unique memory usage signature, and will eventually settle into the memory it needs to process everything properly.
  • Pools of similar threads that share roughly the same tasks with one another, and have thread hopping. Over time, things will average out and all threads will have roughly the same amount of memory.

That is great, but it does present us with a problem, how do we account for that? If thread #17 allocated some memory, and it is now sitting in thread #29’s bank, who is charged for that memory?

The answer is that we always charge the thread that initially allocated the memory, even if it currently doesn’t have that memory available. This is because it is frequently the initial allocation that we need to track, and usage over time just means that we are avoiding constant malloc/free calls.

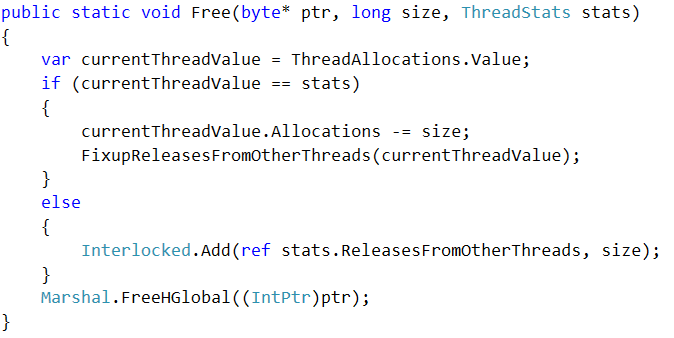
It does present a problem, what happens if thread #29 is freeing memory that belongs to thread #17? Well, we can just decrement the allocated value, but that would force us to always do threads safe operations, which are more expensive.

Instead, we do this:

image

If the freeing thread is the same as the allocation thread, just use simple subtraction, crazy cheap. But if it was allocated from another thread, do the thread safe thing. Then we smash both values together to create the final, complete, picture. 

FUTURE POSTS

No future posts left, oh my!

RECENT SERIES

  1. Challenge (75):
    01 Jul 2024 - Efficient snapshotable state
  2. Recording (14):
    19 Jun 2024 - Building a Database Engine in C# & .NET
  3. re (33):
    28 May 2024 - Secure Drop protocol
  4. Meta Blog (2):
    23 Jan 2024 - I'm a JS Developer now
  5. Production Postmortem (51):
    12 Dec 2023 - The Spawn of Denial of Service
View all series

RECENT COMMENTS

Syndication

Main feed Feed Stats
Comments feed   Comments Feed Stats
}