Oren Eini

CEO of RavenDB

a NoSQL Open Source Document Database

Get in touch with me:

oren@ravendb.net +972 52-548-6969

Posts: 7,520
|
Comments: 51,142
Privacy Policy · Terms
filter by tags archive
time to read 7 min | 1238 words

The last production postmortem that I blogged about in real time was almost a year ago. This is something that makes me very happy, considering the uptick we see in RavenDB usage. All the efforts we put into making RavenDB more stable, predictable and robust has been paying off. The “downside” of that is that I have less interesting stories to tell, of course, but I’ll live with that.

Today’s story, however, is about the nastiest of problems. An occasional slow down in production that cause RavenDB to halt for about 5 seconds. The killer is that this is something that would only reproduce after several weeks of running, and it isn’t consistent. Once in a while, without any consistency, RavenDB would appear to stop processing requests for a period of a few seconds, and then resume normally. Those kind of bugs are the worst, because it is very hard to narrow down exactly what is going on, even before we get to trying to figure out the root cause.

We quickly ruled out the usual suspects. There was no high CPU, swapping to disk or slow I/O that can explain it. We tested the underlying hardware and it seemed fine as well. The problem would usually be quickly fixed if you restarted RavenDB, but sometimes that wasn’t enough. Restarting the whole server was required to get back to the baseline performance. Note that usually, RavenDB performed just fine, it is just that occasionally it would pause.

This naturally made us suspect that we have some issue with the GC causing pauses, but it didn’t make sense. Our allocation rates weren’t high and we didn’t have that big of a managed heap. In short, pretty much all avenues of investigation looked like they were closed to us.

We took several dumps of the process state and inspected what was going on there. Pretty much all indications pointed to there being an issue with the GC, but we couldn’t figure out why. Then we started to analyze the dump file in more detail, here is everything in the dump that was over 100MB:

The total size of the managed heap was just over 8GB, in a system with 64GB of RAM. So nothing really that interesting. The number of strings was high, I’ll admin, much higher than what we’ll usually find in a RavenDB process, but this database instance was doing heavy indexing, so that was probably the reason for this.

But pay very close attention to the second item from the end. That is about 800 MB (!!) of ThreadLocal<WeakReference>.LinkedSlotVolatile array. And that was suspicious. We looked into this a bit more and discovered that we had this tidbit:

00007f8203682ce0    50062      2002480 System.Threading.ThreadLocal`1[[System.WeakReference, System.Private.CoreLib]]

To start with, that isn’t too bad. We have 2MB or so of ThreadLocal<WeakReference> instances, no big deal. But look at the instance count (which is the second column). We had over 50,000 of those. And that didn’t seem right at all.

We started to investigate how ThreadLocal<T> works, and we found that it is really interesting. Here is the in memory structure of a ThreadLocal<T>. The internal structure is quite interesting:

image

Each ThreadLocal<T> instance has an id, which is generated sequentially. For each thread, there is a static thread local array that is allocated to store the values for this thread. The id of the ThreadLocal instance is used to index into this array. The array is for the local thread, but all the values across all threads for a particular ThreadLocal are held together as a doubly linked list.

Note that ThreadLocal has a trackAllValues constructor parameter that does not affect this behavior at all. It simply control whatever you are allowed to call the Values property, not whatever the thread local instance will track all the values.

Due to reasons that I’ll get to later, we created a lot of ThreadLocal instances. That means that we had instance ids in the high tens of thousands. When allocating the thread static array, the ThreadLocal will allocate an array that can hold its id (to the next power of two). So if we have a ThreadLocal with id of 50,062, it will allocate an array with 65,536 elements. That would explain the amount of memory that we saw in the memory dump and is interesting all on its own.

It did not explain the problem with the GC. At least, not yet. As we looked further into this issue, we noticed that this problem only occurred on very large database instances. Ones that had dozens of databases and many indexes. One of the ways that RavenDB ensure isolation of components is to have them each run in a different thread. In those machines,we have had processes that run with thousands of threads, usually in the range of 3000 to 6000.

Combine what we know about ThreadLocal and the number of threads, and you might start to see the problem. Not all ThreadLocals are used in all threads, but when they do, we need to allocate an array that is 65,536 elements in each of the threads. That translate to a total size that is measured in hundreds of millions.

That explains the size, again, but what about the GC speed? I wrote a small isolated test to see what this looks like and I was able to reproduce this on its own. That was really interesting, but I didn’t think that the issue was with ThreadLocal directly. Rather, the problem was with the lattice like structure that we have here. Because of this, I decided to check what it would cost for the GC to run on such a system without dealing with intermediaries.

Here is what this looks like:

On my machine, this code results in GC taking over 200ms each time on a heap that is less than 0.5 GB in size. Given how the GC works, it makes sense. And that means that the accidental lattice structure that we create using ThreadLocal is at the root of our troubles. The question is why do we have so many of them.

Internally, inside Lucene, there is a ThreadLocal<WeakReference> that is being used when you use a particular feature. This is used once per segment, so it isn’t too bad. However, consider what happens over time in a process that have thousands of indexes and is constantly busy?

Each indexing run will create a segment, and each one of them will have a ThreadLocal instance. At the same time, we also have a lot of threads, which create this exact scenario. The problem slowly accumulate over time. As you have more and more indexing runs, you’ll have more and more such instances and you’ll get to bigger and bigger arrays on each thread. This explains why we are able to see the issue only on instances that have been running for weeks, and then, only on those instances that run a particular set of queries that make use of this feature.

We reported the issue to the .NET team and I’m very curious about what the end result will be here. On our end, we are going to have to revamp how we are handling this type of situation. We have a plan of action already and we’ll see over the next week or so how it plays out in production load.

time to read 4 min | 736 words

Image result for hacker clipartThe 4th fallacy of distributed computing is that the network is secured. It is a fallacy because sooner or later, you’ll realize that the network isn’t secured.

Case in point, Microsoft managed to put 250 million support tickets on the public internet. The underlying issue is actually pretty simple. Microsoft had five Elastic Search instances with no security or authentication.

From the emails that were sent, it seems that they were intend to be secured by separating them from the external networks using firewall rules. A configuration error meant that the firewall rule was no long applicable and they were exposed to the public internet. In this case, at least, I can give better marks than “did you really put a publicly addressable database on the internet in the days of Shodan?”

It isn’t a matter of if you’ll be attacked, it is an issue of when. And according to recent reports, the time it takes from being network accessible to being attacked is under a minute. At worst, it took less than a couple of hours for attacks to start.  If it is accessible, it will be attacked.

So it is was good from Microsoft to make sure that it wasn’t accessible, right? Except that it then became accessible. How much are you willing to bet that there was no monitoring on “these machine is not accessible from the internet”? For that matter, I’m not sure how you can write a monitoring system that check for this. The security assumptions changed, and the systems wasn’t robust to handle that. What is worse, it didn’t fail close. It failed wide open.

The underlying cause of this mess is that the assumption that you can trust the network. It is closed, secured and safe. So there was no additional line of defense.

When we designed RavenDB’s security, we started from the assumption that any RavenDB node is publicly accessible and will be attacked. As such, we don’t allow you to run RavenDB on anything but the loopback device without setting up security. Even when you are running inside locked network, you’ll still have mutual authentication between client and server, you’ll still have all communications between client and server encrypted.

Defense in depth is the only thing that make sense. Yes, it is belt and suspenders, but it means that if you have a failure, your privates aren’t hanging in the wind, waiting to be sold on the Dark Web.

When designing a system that listen to the network, you have to start from assuming you’ll be attacked. And any additional steps to reduce the attack surface are just that. They’ll reduce it, not eliminate it. Because a firewall may fail or be misconfigured, and it may not happen to you. But if a completely separate machine on your closed network has been compromised, you best hope that it won’t be able to be a bridgehead for the rest of your system.

This attack expose 250,000,000 support records(!) and it was observed because it was obvious. This is the equivalent of a big pile of money landing at your feet. It gets noticed. But let’s assume that the elastic node was an empty one, so it wouldn’t be interesting. It takes very little from having access to an unsecured server to being able to execute code on it. And then you have a bridgehead. You can then access other servers, which may be accessible from the opened server, but not for the whole wide world. If they aren’t secured, well, it doesn’t matter what your firewall rules say anymore…

The network is always hostile. You can’t assume who is on the other side, or that you aren’t being eavesdropped on. Luckily, we have fairly routine counter measures. Use TLS for everything and make sure that you authenticate. How you do it doesn’t matter that much, to be honest. User / pass over HTTPS or X509 certificate are just different options. And while I can debate which ones are the best, anything is going to better than nothing at all. This applies for in house software as well. You microservices should authenticate, even if they are running in the isolated backend.

Yes, it can be a PITA to configure and deploy, but it isn’t really something that you can give up on. Because the network is always hostile.

time to read 10 min | 1962 words

imageI run into a really interesting discussion on Twitter, I suggest you go over the whole thread, it is fascinating reading.

I have written DI / IoC business applications for a decade and I was heavily involved at a popular IoC container for about five years, including implementing some core features (open generic binding, which was a PITA to do). Given the scope of the topic, I didn’t want to try to squeeze my thoughts on the subject into a Twitter soundbite, hence, this post.

A couple of weeks ago I posted about how I would start a new project today. With just enough architecture to get things started, and not much more. Almost implicit in my design is the fact that the system is composable. You add functionality to the system not by modifying existing code but by adding code. That isn’t new by any means. A quick search of my blog shows a series of posts from 2012 and a system architecture from 2008. No new ground trodden here, then. So why bother writing this post?

RavenDB doesn’t use a container. This is a pretty big and non trivial project that has no container involved. In fact, I don’t usually pull in containers any longer. For a long while, I tried to push as much complexity as possible into the container. It helped that I was part of the team building the container, so I could actually go ahead and add features to the container. That allowed me to create a system that was driven by convention. As long as you followed the convention, things magically worked and everyone was productive. If you didn’t follow the convention, well, I would need to debug that. Other people on the team could figure things out, but it generally fell on me (not that I minded).

The backend for RavenDB Cloud is the first time in a while that I took part in what you can consider as a business application rather than an infrastructure component. And that backend uses a container, IoC, interfaces, multiple dispatch, etc. It makes for a codebase that can adapt quickly, but also adds complexity. In the case of the cloud backend, just to name a few core features, we have: storage, machine allocations, recovery from failure, billing and monitoring. Each one of those may have multiple implementations (each cloud does storage and deployment differently, different accounts have different plans, etc).  Much of this is handled via implementing the relevant interfaces and dispatching to the right location based on the context of the operation.

In many ways, it works like magic. And it allows us to iterate quick and deploy to three separate cloud providers in a short amount of time. It is also magic. Much of our team is actually infrastructure developers. That has a totally different mindset than business app development. When I saw how these developers, with the infrastructure background, worked with the cloud backend, it was very instructive. To them, it was magic, and impenetrable at first. Interestingly enough, they didn’t need to understand all that was going on to get things done. We made sure that they did, after a while, but the IoC allowed us to ignore such concerns until later (gimme a cluster, don’t worry about how it is wired to the rest of the system).

The auto-wiring is one part of what you’ll typically get from a container. There are other, equally important parts, that don’t generally get as much attention: Using IoC usually means a decomposed systems, which is easier to test independently. And in addition to satisfying dependencies, the container is also in charge of managing the lifetime (or scope) of instances.

Let’s talk about the decomposed system and isolated testing first, because this tend to be a high priority for many people. I’m against such systems. Not because it makes testing easier (although keep that in mind, I’ll have something to say about it shortly) but because it is generally a very short slippery slope toward interface explosion. You end up with a lot of interfaces that have a single implementation. You now have composition issue, it is hard to figure out what is the flow of the code because everything is dynamically composed. That lead to a bunch of problems when you read the code (you have to jump around to understand what is going on) as well as performance issues (you can’t inline methods, you have to do interface calls, etc). Out of those, the first issue is far more important, mind.

Surprisingly, given that we have decomposed to small pieces to be able to work with each item independently, we are now in a much worst position if we want to change something. Because the code is scattered in many different locations and is composed on the fly, if I want to make a significant change, I have to make it in many places. To give a concrete example, let’s say that I need to pass a correlation token through my system, to do distributed tracing. I have to modify pretty much all the interfaces involved to pass this token through. And that lead us to the issue I promised with the tests.

A system that is composed of independent interfaces / implementations is easy to test in isolation. Because each implementation is independent and isolated from other areas of the system. The issue with such a system is that each individual component isn’t really doing much on its own. The benefit of the system is from multiple such components are assembled and working together. So the critical functionality that you have is the composed bundle, as well as the container configuration. But to test that, you need a system test. So you might as well structure you system so that system tests are easy, fast and obvious. Here is another way to do just that.

Finally, we get to the issue of lifetime management. It is easy to ignore just how important this feature is. Usually, you have three lifetimes in your application:

  • Singleton – for the entire application.
  • Transient – get a new instance each time.
  • Scoped – get the same instance in the same scope (typically a single requests).

Being able to rely on the container to manage lifetime is huge, because it is easy to mess things up. A good container will also match dependencies by their lifetimes. So if you have a singleton component it cannot accept a transient component since the lifetimes don’t match (but the other way around is obviously fine). There is an issue here as well. If you are injecting the dependencies, it is easy to lose track of the lifetime of your dependencies. It is easy to get into a situation where you (inadvertently, even) use a dependency to manage state between invocations and not realize that you have now relying on the lifetime of a dependency (or a dependency of dependency).

You might have noticed a theme in this post. I’m outlining a lot of problems, but no solutions. I’ll get to that in a bit, but I wanted to explain something important. Writing non trivial software is complex. This is the nature of the beast. We can re-arrange the complexity or we can sweep it under the rug. There are good use cases for either option, but I would rather that people make this choice explicitly. What you can’t do is eliminate the complexity entirely, at best, you have tamed it.

Earlier, I said that RavenDB doesn’t use a container, which is true (somewhat). But it is using inversion of control. A lot of the core classes are using constructor injection, for example. Let’s take what is probably the most important class we have, DocumentDatabase. That is the class that represent a database inside a RavenDB process. It accept its dependencies (the configuration, the server it is running on, etc) and then is constructed. We don’t use a container here because the setup process of a database in RavenDB is complex. We first create the DocumentDatabase instance, then we have to initialize it. Initializing a database may mean running recovering, loading a lot of data from disk, etc. So we do that in an async manner. When a request comes in for a particular database, we get it, or wait until it is loaded. We will also dispose the database if it has been idle for enough time. So in this case, we have complex (async) initialization, in which we have to deal with a lot of failure modes. We also have a lifetime scope that is based on idle time, which doesn’t fit the usual modes for a container.

Because we manually control how we create the database instance, it is explicit what its dependencies, lifetime and behavior are. We have quite a few example of such classes. For example, the database instance holds DocumentStorage, AttachmentStorage, etc. It is important to note that the number if finite and relatively small. It allow us to reason about the interaction in the database in a static and predictable manner.

Remember when I said that we don’t use a container? That is almost true. There is one location where I wrote our own mini container. One thing that RavenDB has a lot of is Endpoints. An endpoint is the method that handles a particular HTTP request. At last count we had over 300 of them. I don’t have the time / willingness to wire all of these manually. That would put undue burden on developing a new endpoint. And that is the key observation. For stuff that doesn’t change very often (the structure of the database), we do things manually. For the things that we add a lot of (endpoints), we make it as smooth as possible. Adding a new endpoint is adding a class that inherit from a known base class, and that is pretty much it.

Our routing infrastructure will gather all of the implementation, wire up the routing and when a request come in will create an instance of the class in question, inject it the relevant context (what database it is running on, the current request, etc) and then execute it. Just like a container would, in fact, because for all intents and purposes, it is one. What we have done is optimize one aspect, which we deal with often, while manually dealing with the stuff that is rarely changing. That means that if I do need to make a change there, the level of magic involved is greatly reduced. And in RavenDB in particular, we can and have measured the difference in performance between running things through any abstraction layer and doing things directly. To the point where in certain parts of our codebase, an interface method invocation is forbidden because the cost would be too high.

There is another aspect of this architecture, it means that the easiest thing in our code would be to add a new endpoint. That being the easiest thing, it is usually what will happen. This means that we’re far more likely to follow the open/closed principal. It also lead to most of our code looking fairly similar in shape. That make maintenance, code reviews and the act of writing new code a lot simpler. I don’t have to make decisions about structure, I just have to let the code flow.

time to read 4 min | 797 words

In my last post, I talked about how to store and query time series data in RavenDB. You can query over the time series data directly, as shown here:

You’ll note that we project a query over a time range for a particular document. We could also query over all documents that match a particular query, of course. One thing to note, however, is that time series queries are done on a per time series basis and each time series belong to a particular document.

In other words, if I want to ask a question about time series data across documents, I can’t just query for it, I need to do some prep work first. This is done to ensure that when you query, we’ll be able to give you the right results, fast.

As a reminder, we have a bunch of nodes that we record metrics of. The metrics so far are:

  • Storage – [ Number of objects, Total size used, Total storage size].
  • Network – [Total bytes in, Total bytes out]

We record these metrics for each node at regular intervals. The query above can give us space utilization over time in a particular node, but there are other questions that we would like to ask. For example, given an upload request, we want to find the node with the most free space. Note that we record the total size used and the total storage available only as time series metrics. So how are we going to be able to query on it? The answer is that we’ll use indexes. In particular, a map/reduce index, like the following:

This deserve some explanation, I think. Usually in RavenDB, the source of an index is a docs.[Collection], such as docs.Users. In this case, we are using a timeseries index, so the source is timeseries.[Collection].[TimeSeries]. In this case, we operate over the Storage timeseries on the Nodes collection.

When we create an index over a timeseries, we are exposed to some internal structural details. Each timestamp in a timeseries isn’t stored independently. That would be incredibly wasteful to do. Instead, we store timeseries together in segments. The details about how and why we do that don’t really matter, but what does matter is that when you create an index over timeseries, you’ll be indexing the segment as a whole. You can see how the map access the Entries collection on the segment, getting the last one (the most recent) and output it.

The other thing that is worth noticing in the map portion of the index is that we operate on the values of the time stamp. In this case, Values[2] is the total amount of storage available and Values[1] is the size used. The reduce portion of the index, on the other hand, is identical to any other map/reduce index in RavenDB.

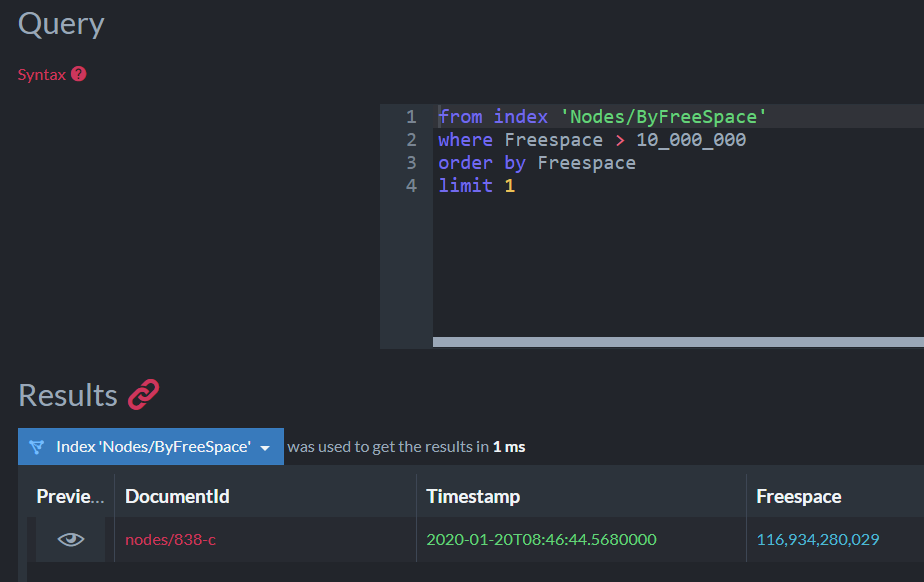
What this index does, essentially, is tell us what is the most up to date free space that we have for each particular node. As for querying it, let’s see how that works, shall we?

image

Here we are asking for the node with the least disk space that can contain the data we want to write. This can be reduce fragmentation in the system as a whole, by ensuring that we use the best fit method.

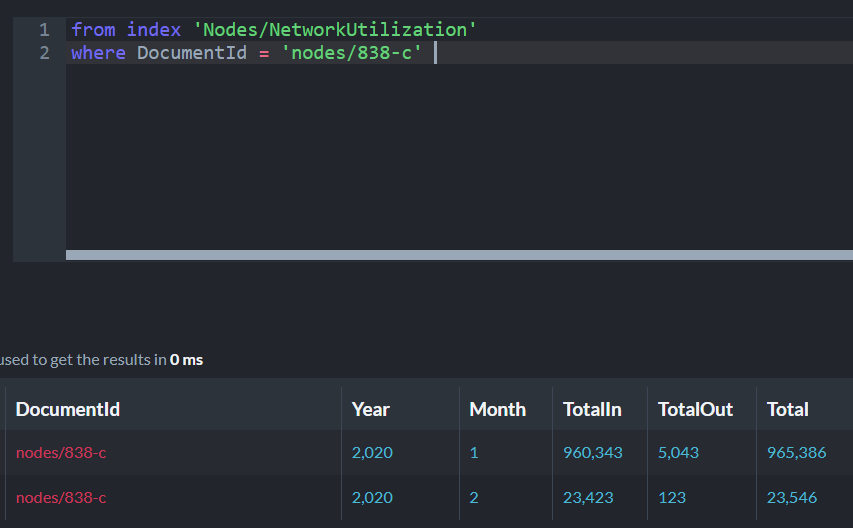
Let’s look at a more complex example of indexing time series data, computing the total network usage for each node on a monthly basis. This is not trivial because we record network utilization on a regular basis, but need to aggregate that over whole months.

Here is the index definition:

As you can see, the very first thing we do is to aggregate the entries based on their year and month. This is done because a single segment may contain data from multiple months. We then sum up the values for each month and compute the total in the reduce.

image

The nice thing about this feature is that we are able to aggregate large amount of data and benefit from the usual advantages of RavenDB map/reduce indexes. We have already massaged the data to the right shape, so queries on it are fast.

Time series indexes in RavenDB allows us to merge time series data from multiple documents, I could have aggregated the computation above across multiple nodes to get the total per customer, so I’ll know how much to charge them at the end of the month, for example.

I would be happy to know hear about any other scenarios that you can think of for using timeseries in RavenDB, and in particular, what kind of queries you’ll want to do on the data.

time to read 4 min | 633 words

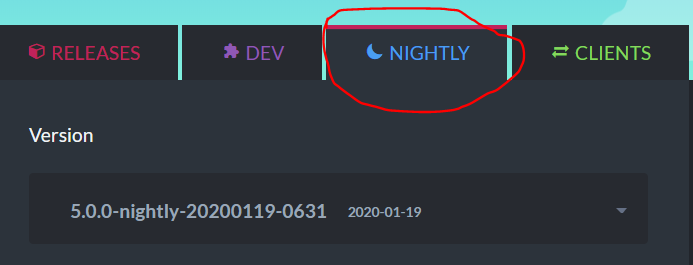
RavenDB 5.0 is coming soon and the big new there is time series support. We have gotten to the point where we can actually show off what we can do, which makes me very happy. You can use the nightlies builds to explore time series support in RavenDB 5.0. Client side packages for 5.0 are also available.

image

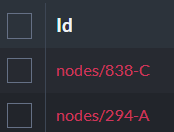
I went ahead and created a new database and created some documents:

image

Time series are often used for monitoring, so I decided to go with the flow and see what kind of information we would want to store there. Here is how we can add some time series data to the documents:

I want to focus on this for a bit, because it is important. A time series in RavenDB has the following details:

  • The timestamp to associate to the values – in the code above, this is the current time (UTC)
  • The tag associated with the timestamp – in the code above, we record what devices and interfaces these measurements belong to.
  • The measurements themselves – RavenDB allows you to record multiple values for a single timestamp. We threat them as an array of values, and you can chose to put them in a single time series or to split them.

Let’s assume that we have quite a few measurements like this and that we want to look at the data. You can explore things in the Studio, like so:

image

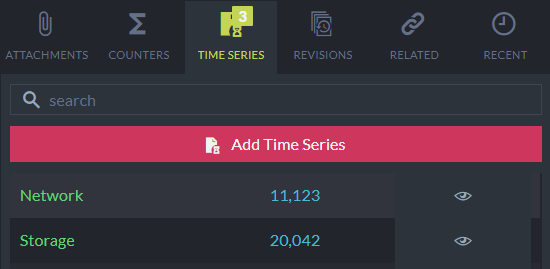
We have another tab in the Studio that you can look at which will give you some high level details about the timeseries for a particular document. We can dig deeper, too, and see the actual values:

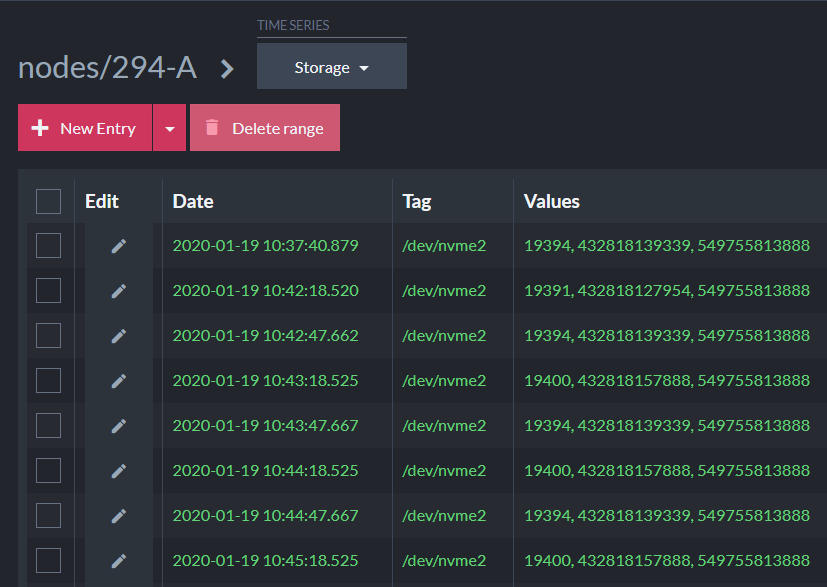
image

You can also query the data to see the patterns and not just the individual values:

The output will look like this:

image

And you can click on the eye to get more details in chart form. You can see a little bit of this here, but it is hard to do it justice with a small screen shot:

image

Here is what the data you get back from this query:

The ability to store and process time series data is very important for monitoring, IoT and healthcare systems. RavenDB is able to do quite well in these areas. For example, to aggregate over 11.7 million heartrate details over 6 years at a weekly resolution takes less than 50 ms.

We have tested timeseries that contained over 150 million entries and we can aggregate results back over the entire data set in under three seconds. That is a nice number, but it doesn’t match what dedicated time series databases can do. It represents a rate of about 65 million rows / second. ScyllaDB recently published a benchmark in which they talk about billion rows / sec. But they did that on 83 nodes, so they did just 12 million / sec per node. Less than a fifth of RavenDB’s speed.

But that is being unfair, to be honest. While timeseries queries are really interesting, we don’t really expect users to query very large amount of data using raw queries. That is what we have indexes for, after all. I’m going to talk about this in depth in my next post.

time to read 6 min | 1100 words

When it comes to security, the typical question isn’t whatever they are after you but how much. I love this paper on threat modeling, and I highly recommend it. But sometimes, you have information that you just don’t want to have. In other words, you want to store information inside of the database, but without the database or application being able to read said information without a key supplied by the user.

For example, let’s assume that we need to store the credit card information of a customer. We need to persist this information, but we don’t want to know it. We need something more from the user in order to actually use it.

The point of this post isn’t actually to talk about how to store credit card information in your database, instead it is meant to walk you through an approach in which you can keep data about a user that you can only access in the context of the user.

In terms of privacy, that is a very important factor. You don’t need to worry about a rogue DBA trawling through sensitive records or be concerned about a data leak because of an unpatched hole in your defenses. Furthermore, if you are carrying sensitive information that a third party may be interested in, you cannot be compelled to give them access to that information. You literally can’t, unless the user steps up and provide the keys.

Note that this is distinctly different (and weaker) than end to end encryption. With end to end encryption the server only ever sees encrypted blobs. With this approach, the server is able to access the encryption key with the assistance of the user. That means that if you don’t trust the server, you shouldn’t be using this method. Going back to the proper threat model, this is a good way to ensure privacy for your users if you need to worry about getting a warrant for their data. Basically, consider this as one of the problems this is meant to solve.

When the user logs in, they have to use a password. Given that we aren’t storing the password, that means that we don’t know it. This means that we can use that as the user’s personal key for encrypting and decrypting the user’s information. I’m going to use Sodium as the underlying cryptographic library because that is well known, respected and audited. I’m using the Sodium.Core NuGet package for my code samples. Our task is to be able to store sensitive data about the user (in this case, the credit card information, but can really be anything) without being able to access it unless the user is there.

A user is identified using a password, and we use Argon2id to create the password hash. This ensures that you can’t brute force the password. So far, this is fairly standard. However, instead of asking Argon2 to give us a 16 bytes key, we are going to ask it to give us a 48 bytes key. There isn’t really any additional security in getting more bytes. Indeed, we are going to consider only the first 16 bytes that were returned to us as important for verifying the password. We are going to use the remaining 32 bytes as a secret key. Let’s see how this looks like in code:

Here is what we are doing here. We are getting 48 bytes from Argon2id using the password. We keep the first 16 bytes to authenticate the user next time. Then we generate a random 256 bits key and encrypt that using the last part of the output of the Argon2id call. The function returns the generated config and the encryption key. You can now encrypt data using this key as much as you want. But while we assume that the CryptoConfig is written to a persistent storage, we are not keeping the encryption key anywhere but memory. In fact, this code is pretty cavalier about its usage. You’ll typically store encryption keys in locked memory only, wipe them after use, etc. I’m skipping these steps here in order to get to the gist of things.

Once we forget about the encryption key, all the data we have about the user is effectively random noise. If we want to do something with it, we have to get the user to give us the password again. Here is what the other side looks like:

We authenticate using the first 16 bytes, then use the other 32 to decrypt the actual encryption key and return that. Without the user’s password, we are blocked from using their data, great!

You’ll also notice that the actual key we use is random. We encrypt it using the key derived from the user’s password but we are using a random key. Why is that? This is to enable us to change passwords. If the user want to change the password, they’ll need to provide the old password as well as the new. That allows us to decrypt the actual encryption key using the key from the old password and encrypt it again with the new one.

Conversely, resetting a user’s password will mean that you can no longer access the encrypted data. That is actually a feature. Leaving aside the issue of warrants for data seizure, consider the case that we use this system to encrypt credit card information. If the user reset their password, they will need to re-enter their credit card. That is great, because that means that even if you managed to reset the password (for example, by gaining access to their email), you don’t get access tot he sensitive information.

With this kind of system in place, there is one thing that you have to be aware of. Your code needs to (gracefully) handle the scenario of the data not being decryptable. So trying to get the credit card information and getting an error should be handled and not crash the payment processing system Smile. It is a different mindset, because it may violate invariants in the system. Only users with a credit card may have a pro plan, but after a password reset, they “have” a credit card, in the sense that there is data there, but it isn’t useful data. And you can’t check, unless you had the user provide you with the password to get the encryption key.

It means that you need to pay more attention to the data model you have. I would suggest not trying to hide the fact that the data is encrypted behind a lazily decryption façade but deal with it explicitly.

time to read 1 min | 100 words

On Tuesday, January 21, 2020 10:30 AM Eastern Time, I’ll be doing a webinar show casing some of the unique features of RavenDB.

We talk a lot about new features and exciting stuff that we work on, but RavenDB has been around for a decade and some of the most impressive stuff that we have are still features that I built around 2009.

I’m going to give a guided tour into some of the features that don’t share much of the limelight but can be real work horses in your application.

You can register to the webinar here.

time to read 5 min | 829 words

In RavenDB Cloud, we routinely monitor the usage of the RavenDB Cluster that our customers run. We noticed something strange in one of them, the system utilization didn’t match the expected load given the number of requests the cluster was handling. We talked to the customer to try to figure out what was going and we had the following findings (all details are masked, naturally, but the gist is the same).

  • The customer stores millions of documents in RavenDB.
  • The document sizes range from 20KB – 10 MB.

Let’s say that the documents in questions were BlogPosts which had a Comments array in them. We analyzed the document data and found the following details:

  • 99.89% of the documents had less than 100 comments in them.
  • 0.11% of the documents (a few thousands) had more than 100 comments in them.
  • 99.98% of the documents had less than 200 comments in them.
  • 0.02% of the documents had more than 200 comments in them!

Let’s look at this 0.02%, shall we?

image

The biggest document exceeded 10 MB and had over 24,000 comments in it.

So far, that didn’t seem like a suboptimal modeling decision, which can lead to some inefficiencies for those 0.02% of the cases. Not ideal, but no big deal. However, the customer also defined the following index:

from post in docs.Posts from comment in post.Comments select new { ... }

Take a minute to look at this index. Note the parts that I marked? This index is doing something that look innocent. It index all the comments in the post, but it does this using a fanout. The index will contain as many index entries as the document has comments. We also need to store all of those comments in the index as well as in the document itself.

Let’s consider what is the cost of this index as far as RavenDB is concerned. Here is the cost per indexing run for different sized documents, from 0 to 25 comments.

image

This looks like a nice linear cost, right? O(N) cost as expected. But we only consider the cost for a single operation. Let’s say that we have a blog post that we add 25 comments to, one at a time. What would be the total amount of work we’ll need to do? Here is what this looks like:

image

Looks familiar? This is O(N^2) is all its glory.

Let’s look at the actual work done for different size documents, shall we?

image

I had to use log scale here, because the numbers are so high.

The cost of indexing a document with 200 comments is 20,100 operations. For a thousand comments, the cost is 500,500 operations.  It’s over 50 millions for a document with 10,000 comments.

Given the fact that the popular documents are more likely to change, that means that we have quite a lot of load on the system, disproportional to the number of actual requests we have, because we have to do so much work during indexing.

So now we know what was the cause of the higher than expected utilization. The question here, what can we do about this? There are two separate issues that we need to deal with here. The first, the actual data modeling, is something that I have talked about before. Instead of putting all the comments in a single location, break it up based on size / date / etc. The book also has some advice on the matter. I consider this to be the less urgent issue.

The second problem is the cost of indexing, which is quite high because of the fanout. Here we need to understand why we have a fanout. The user may want to be able to run a query like so:

This will give us the comments of a particular user, projecting them directly from their store in the index. We can change the way we structure the index and then project the relevant results directly. Let’s see the code:

As you can see, instead of having a fanout, we’ll have a single index entry per document. We’ll still need to do more work for larger documents, but we reduced it significantly. More importantly, we don’t need to store the data. Instead, at query time, we use the where clause to find documents that match, then project just the comments that we want back to the user.

Simple, effective and won’t cause your database’s workload to increase significantly.

time to read 4 min | 798 words

RavenDB has two separate APIs that allow you to get push notifications from the database. The first one is the Subscriptions API, which allows you to define a query such as:

And then subscribe to it like so:

RavenDB will now push batches of orders that match your query to the client. This is done in a reliable manner. If the client fails for any reason, it can reconnect and resume from where it left off. If the server failed, the cluster will automatically reassign the work to another node and the client will pick up from where it left off. The subscription is also persistent, that means that whenever you connect to it, you don’t start from the beginning. After the subscription has caught up with all the documents that match the query, it isn’t over. Instead, the client will wait for new or updated documents to come in so the server can push them immediately. The typical latency between a document change and the subscription processing it is about twice the ping time between the client and server (so in the order of milliseconds). Only a single client at a time can have a particular subscription open, but multiple clients can contend on the subscription. One of them will win and the others will wait for the subscription to become available (when the first client stop / fail / crash, etc).

This make subscriptions highly suitable for business processing. It is reliable, you already have high availability on the server side and you can easily add that on the client side. You can use complex queries and do quite a bit of work on the database side, before it ever reaches your code. Subscriptions also allow you to run queries over revisions, so instead of getting the current state of the document, you’ll be called with the (prev, current) tuple on any document change. That gives you even more power to work with.

On the other hand, subscriptions requires RavenDB to manage quite a bit of (distributed) state and as such consume resources at the cluster level.

The Changes API, on the other hand, has a very different model, let’s look at the code first, and then discuss this in details:

As you can see, we can subscribe to changes on a document or a collection. We actually have quite a bit of events that we can respond to. A document change (by id, prefix or collection), an index (created / removed, indexing batch completed, etc), an operation (created / status changed / completed), a counter (created / modified), etc.

Some things that can be seen even from just this little bit of code. The Changes API is not persistent. That means, if you’ll restart the client and reconnect, you’ll not get anything that already happened. This is intended for ongoing usage, not for critical processing. You also cannot do any complex queries with changes. You have the filters that are available and that is it. Another important distinction is that with the Subscription API, you are getting the document (and can also include additional ones), but with the Changes API, you’re getting the document id only.

The most common scenario for the Changes API is to implement this:

image

Whenever a user is editing a particular document, you’ll subscribe to the document and if it changed behind the scenes, you can notify the user about this so they won’t continue to edit the document and get an optimistic concurrency error on save.

The Changes API is also used internally by RavenDB to implement a lot of features in the Studio and for tracking long running operations from the client. It is lightweight and requires very little resources from the server (and none from the cluster). On the other hand, it is meant to be a best effort feature. If the Changes connection has failed, the client will transparently reconnect to the server and re-subscribe to all the pending subscriptions. However, any changes that happened while the client was not connected are lost.

The two APIs are very similar on the surface, both of them allow you to get push notifications from RavenDB but their usage scenarios and features are very different. The Changes API is literally that, it is meant to allow you to watch for changes. Probably because you have a human sitting there and looking at things. It is meant to be an additional feature, not a guarantee. The Subscriptions API, on the other hand, is a reliable system and can ensure that you’ll not miss out of notifications that matter to you.

You can read more about Subscriptions in RavenDB in the book, I decided a whole chapter to it.

time to read 3 min | 469 words

I was talking with a developer about their system architecture and they mentioned that they are going through some complexity at the moment. They are changing their architecture to support higher scaling needs. Their current architecture is fairly simple (single app talking to a database), but in order to handle future growth, they are moving to a distributed micro service architecture. After talking with the dev for a while, I realized that they were in a particular industry that had a hard barrier for scale.

I’m not sure how much I can say, so let’s say that they are providing a platform to setup parties for newborns in a particular country. I went ahead and checked how many babies you had in that country, and the number has been pretty stable for the past decade, sitting on around 60,000 babies per year.

Remember, this company provide a specific service for newborns. And that service is only applicable for that country. And there are about 60,000 babies per year in that country. In this case, this is the time to do some math:

  • We’ll assume that all those births happen on a single month
  • We’ll assume that 100% of the babies will use this service
  • We’ll assume that we need to handle them within business hours only
  • 4 weeks x 5 business days x 8 business hours = 160 hours to handle 60,000 babies
  • 375 babies to handle per hour
  • Let’s assume that each baby requires 50 requests to handle
  • 18,750 requests / hour
  • 312 requests / minute
  • 5 requests / second

In other words, given the natural limit of their scaling (number of babies per year), and using very pessimistic accounting for the load distribution, we get to a number of requests to process that is utterly ridiculous.

It would be hard to not handle this properly on any server you care to name. In fact, you can get a machine under 150$ / month that has 8 cores. That gives you a core per requests per second, with 3 to spare.

Even if we have to deal with spikes of 50 requests / second. Any reasonable server ( the < 150% / month I mentioned) should be able to easily handle this.

About the only way for this system to get additional load is if there is a population explosion, at which point I assume that the developers will be busy handling nappies, not watching the CPU utilization.

For certain type of applications, there is a hard cap of what load you can be expected to handle. And you should absolutely take advantage of this. The more stuff you can not do, the better you are. And if you can make reasonable assumptions about your load, you don’t need to go crazy.

Simpler architecture means faster time to market, meaning that you can actually deliver value, rather than trying to prepare for the Babies’ Apocalypse.

FUTURE POSTS

No future posts left, oh my!

RECENT SERIES

  1. Challenge (75):
    01 Jul 2024 - Efficient snapshotable state
  2. Recording (14):
    19 Jun 2024 - Building a Database Engine in C# & .NET
  3. re (33):
    28 May 2024 - Secure Drop protocol
  4. Meta Blog (2):
    23 Jan 2024 - I'm a JS Developer now
  5. Production Postmortem (51):
    12 Dec 2023 - The Spawn of Denial of Service
View all series

Syndication

Main feed Feed Stats
Comments feed   Comments Feed Stats
}