Oren Eini

CEO of RavenDB

a NoSQL Open Source Document Database

Get in touch with me:

oren@ravendb.net +972 52-548-6969

Posts: 7,546
|
Comments: 51,161
Privacy Policy · Terms
filter by tags archive
time to read 2 min | 400 words

I have just finished 2nd pass editing all the chapters and appendixes for my DSL book. This has been, I think, the 1,390th time that I had gone through the book since I finished writing it. Luckily for me, this appears to be the end, there is the final printer proofs stage, and then I’ll truly be free.

One of the things that I wasn’t told about when I agree to write the book is just how many times I would have to read it. I think that I am good writer (God knows that I get enough practice), but for crying out load, there is only so many times that I can read the same piece (especially if I wrote it) before it gets pretty boring.

Now, to be absolutely clear, the publisher is doing great job, and I think that each pass has been extremely valuable. We found problems in grammar, spelling, fuzzy speak, missing concepts, bugs in code, etc. This is important, valuable and necessary.

One of the things that some people have hard time understanding about the way that I think is that I can accept that some things are necessary even if they aren’t fun. That mean that I’ll do them, but I’ll complain about it. Just like taxes. I’ll pay them, but I reserve the right to bitch about it.

It took me a while to understand why I hate editing so much. I know how to handle boring work, and I know how to handle creative work. What I don’t know how to handle is boring creative work. I split my attention when I am doing boring stuff, usually having something in the background that it interesting while I am doing the boring stuff. For creative stuff, I usually enjoy it.

But boring creative stuff? I can’t split my attention then, and it is boring. It is annoying, and I do think about it like a tax.

Consider this statement, that was flagged by my editor:

The MacroMacro passes the MacroStatement that the compiler hands to the macro using the name of the macro

Can you figure out what I meant here? It took me a while to do that :-)

Editing the book has been a huge weight on my mind, having finished that is such a huge relief…

time to read 3 min | 496 words

image A while ago I was chatting with a friend that complained about a migration script timing out on his local machine. When I looked at the script, it was fairly obvious what was wrong:

DECLARE @VideoID UNIQUEIDENTIFIER
DECLARE @NewID UNIQUEIDENTIFIER

DECLARE VideoCursor CURSOR READ_ONLY
FOR
SELECT ID FROM Video

OPEN VideoCursor

FETCH NEXT FROM VideoCursor
INTO @VideoID

WHILE @@FETCH_STATUS = 0
BEGIN
    SET @NewID = NEWID()
   
    INSERT INTO Content (ID, Body, FormatBody, Plain)
        SELECT @NewID, ContentItem.Body, Video.FormatBody, Video.Plain
        FROM ContentItem
        INNER JOIN Video
        ON Video.Id=ContentItem.ID
        WHERE Video.Id=@VideoID
   
    UPDATE Video SET ContentId=@NewID WHERE Video.Id=@VideoID
       
    UPDATE ThumbImage SET ContentId=@NewID WHERE Video_id=@VideoID
   
    FETCH NEXT FROM VideoCursor
    INTO @VideoID
END

The script was using a cursor!

Every time you want a use a cursor, you must fast for three days while reading the memoires of Edgar F. Codd.

Cursors are evil!

Let us see how we can make this work using set based logic, shall we?

INSERT INTO #TempContent 
SELECT newid() as NewId, Video.Id as OldId, ContentItem.Body, Video.FormatBody, Video.Plain
FROM ContentItem
INNER JOIN Video
ON Video.Id=ContentItem.ID
WHERE Video.Id=@VideoID

INSERT INTO Content(ID, Body, FormatBody, Plain)
SELECT NewId, ContentItem.Body, Video.FormatBody, Video.Plain

UPDATE Video 
SET ContentId=NewId 
FROM #TempContent
WHERE Video.Id=OldId

UPDATE ThumbImage 
SET ContentId=NewId 
FROM #TempContent
WHERE Video.Id=OldId

DROP TABLE #TempContent

I can assure you that this will work faster, read better, get parallelize by the database and in generally be better behaved than the previous version.

time to read 11 min | 2101 words

After running into sever performance issues when using MSMQ and transactions, I decided to run a more thorough test case.

Writing 10,000 messages to MSMQ Transactional Queue, separate transactions:

private static void AddData(MessageQueue q1, byte[] bytes)
{
    Console.WriteLine("{0:#,#}", bytes.Length);
    var sp = Stopwatch.StartNew();
    for (int i = 0; i < 10000; i++)
    {
        using (var msmqTx = new MessageQueueTransaction())
        {
        
            msmqTx.Begin();
            
            q1.Send(new Message
            {
                BodyStream = new MemoryStream(bytes),
                Label = i.ToString()
            }, msmqTx);

            msmqTx.Commit();
        }

        if (i%10 == 0) Console.WriteLine(i);
    }
    q1.Dispose();

    Console.WriteLine("{0:#,#}", sp.ElapsedMilliseconds);
}

This took 6.08 seconds, or about 1,600 messages per second.

Writing 10,000 messages to MSMQ Transaction Queue, single transaction:

private static void AddData(MessageQueue q1, byte[] bytes)
{
    Console.WriteLine("{0:#,#}", bytes.Length);
    var sp = Stopwatch.StartNew();
    using (var msmqTx = new MessageQueueTransaction())
    {

        msmqTx.Begin(); for (int i = 0; i < 10000; i++)
        {


            q1.Send(new Message
            {
                BodyStream = new MemoryStream(bytes),
                Label = i.ToString()
            }, msmqTx);


            if (i % 10 == 0) Console.WriteLine(i);
        }
        msmqTx.Commit();
    }
    q1.Dispose();

    Console.WriteLine("{0:#,#}", sp.ElapsedMilliseconds);
}

This took 0.825 seconds for 10,000 messages, so it should be able to process about 12,000 messages per second. But this is not a realistic scenario.

Now, to my test scenario, which is touching two queues for 10,000 messages…

Wait! I accidently run the wrong code, and that led me down the following path:

private static void JustTx()
{
    var sp = Stopwatch.StartNew();
    int msgs = 0;
    for (int i = 0; i < 1000; i++)
    {
        using (var msmqTx = new MessageQueueTransaction())
        {
            msmqTx.Begin();
            msgs = msgs + 1;
            if (msgs % 10 == 0)
                Console.WriteLine(msgs);
            
            msmqTx.Commit();
        }
    }
    Console.WriteLine("{0:#,#}", sp.ElapsedMilliseconds);
}

This code is just running & committing MSMQ transaction, no actual operation is done on the queue, and there shouldn’t be any work for the system. We open & close a 1,000 transactions. That takes 17 seconds.

Remember, this is just open/close MSMQ local transaction, with no work done, and that gives me about 60 transactions per second. I think that I found my culprit.  I have other independent verification of this, and I find it extremely sad.

I am still waiting to hear from MSMQ experts about what is going on.

In the meantime, I tested this with my own queuing project, Rhino Queues. The first thing that I tried was the simplest, unrealistic scenario of sending 10,000 messages in a single transaction:

private static void AddData(IQueueManager manager, byte[] bytes)
{
    var sp = Stopwatch.StartNew();
    using (var tx = new TransactionScope())
    {
        for (int i = 0; i < 10000; i++)
        {
            manager.Send(new Uri("rhino.queues://localhost:2222/test1"), new MessagePayload
                {
                    Data = bytes
                });


            if (i % 10 == 0)
                Console.WriteLine(i);
        }
        tx.Complete();
    }

    Console.WriteLine("{0:#,#}", sp.ElapsedMilliseconds);
}

This code takes 12.2 seconds to run, giving about 800 message per second. Not bad, but not really good either. In this scenario MSMQ finished everything in less than a second.

Let us see a more realistic scenario, of sending 10,000 messages in 10,000 separated transactions:

private static void AddData(IQueueManager manager, byte[] bytes)
{
    var sp = Stopwatch.StartNew();

    for (int i = 0; i < 10000; i++)
    {
        using (var tx = new TransactionScope())
        {
            manager.Send(new Uri("rhino.queues://localhost:2222/test1"), new MessagePayload
            {
                Data = bytes
            });


            if (i % 10 == 0)
                Console.WriteLine(i);
            tx.Complete();
        }
    }

    Console.WriteLine("{0:#,#}", sp.ElapsedMilliseconds);
}

This completes in 3.7 minutes, for about 45 messages per second. Slightly worse than what MSMQ can do, which isn’t good.

However, the good part about using Rhino Queues is that I know what is going on there and I intentionally left some points of optimization out (get it working, get it working right, get it working fast). After exploring some of those optimizations, the same code base run for 2.7 minutes, so we saved 60 seconds on the runtime, bringing us to 60 messages per second.

Rhino Queues is now comparable to MSMQ performance in this scenario. I find this spooky, to tell you the truth. Profiling Rhino Queues tells me that most of the time with Rhino Queues (over 40%!) is spent not in Rhino Queues, but inside System.Transactions.Transaction.Dispose().

I wonder how I can reduce that load.

The next thing I tried was implementing ISinglePhaseNotification. This means that if there are no other durable enlistments for the DTC, Rhino Queues will be able to take advantage of the lightweight transactions support in System.Transactions.

That change had a dramatic effect. I can’t really grasp the perf difference!

The code (same code!) now executes in 16.7 seconds! That means 600 messages per second.

Of course, things aren’t as good when you compare the CopyData routine:

private static void CopyData(IQueueManager manager)
{

    Stopwatch sp = Stopwatch.StartNew();
    for (int i = 0; i < 10000; i++)
    {
        using (var tx = new TransactionScope())
        {
            var message = manager.Receive("test1");
            manager.Send(new Uri("rhino.queues://localhost/test2"), new MessagePayload
            {
                Data = message.Data,
                Headers = message.Headers
            });

            if (i % 10 == 0)
                Console.WriteLine(i);
            tx.Complete();
        }
    }

    Console.WriteLine("{0:#,#}", sp.ElapsedMilliseconds);
}

This guy takes 5.7 minutes to complete, at a rate 30 messages per second. That is pretty lame. Similar code with MSMQ did 60 message per second on my machine, and I considered that utterly unacceptable.

Firing up dotTrace showed me that I was being STUPID (as in, not just stupid, or Stupid with a capital s, but full fledged stupid in all caps) and didn’t clean out the queue from read messages. After I fixed that, the same code run in 1.5 minutes, or about 110 messages per second.

Nice.

And I still consider being almost twice as fast as MSMQ to be very spooky.

time to read 9 min | 1715 words

This is a fictitious  example of such a bug, but this would probably sound familiar.

Jane was soundly sleeping around 3AM when the phone started ringing off the hook. Dazed and not quite in full possession of her faculties, she picked up the phone and heard Tom from Operations screaming that the Northwind System was gone. It wasn’t just one application that died, it was all of them, and Operations had no idea what is going on, any CxO in the company was pissed and they were bleeding money and reputation by the second.

While driving to work, Jane took part in a conference call trying to figure out what happened. The following things became clear:

  • There had been no changes to the production environment in the last week.
  • The last change was in the reporting system, which was humming along for the last two weeks or so.
  • Database servers were pegged by ridiculous amounts of queries from all applications.
  • Cache servers were up and functioning.
  • The production logs verbosity was adjusted and it seemed that every single query was a cache miss.

It became clear that something cause every single application to skip the cache and go directly to the database, but no one knew what.

Upon arriving at the office, they run into more puzzlement, frustration and anger. The problem was definitely related to the cache, but there was absolutely no explanation for that. The cache code was written several years ago, it was a pretty complex piece of code, and it was tested in production for almost as long.

The first suspicion fell on some sort of communication breakage between the application servers and the cache servers, but that was quickly ruled out. Looking at the logs, it was clear that the problem was 100% cache misses causing every single query to hit the database, which responded by throwing up its hands and sulking, refusing to talk to anyone.

The problem was absolutely non reproducible in the test or development environment.

The team decided to appropriate a single production server and run their tests on it. In production, it was absolutely reproducible, but no one could figure out why. Network traces from that server showed that it never even tried to connect to the cache servers for reading the queries, however, it would happily connect to the cache servers for writing the queries.

The root problem was found, then, somehow, there was a problem in reading data from the cache servers. Three developers and at least one IT guy were willing to swear on the religion of your choice that this is absolutely not possible, but evidence suggested otherwise.

Installing a kernel level network trace was suggested. After installing the trace and rebooting the machine, the team hovered over the admin head while they started up the application again and watched the network trace from the kernel. This time, however, they could see it reading from the cache servers.

Not only that, but it looked like the application was functioning normally! Installing the kernel trace fixed the problem! Since this was an issue of production being down, they tried the same method on a second server, and that came back up normally as well. Every single IT guy in the building was suddenly busy installing a kernel network trace, and lo and behold, the entire system came back up.

By that time, it was close to 4 PM of the following day, and just about everyone was exhausted. The CTO sent everyone whom and scheduled a meeting at 9 AM to discuss what happened.

At 9 AM the following day, no one could really suggest a working hypothesis for what actually happened. The Administration Module Team Lead suggested that their system has run into some threading bug in the network stack and installing the kernel level trace had changed the timing just enough to make the problem go away. The Reporting Module Team Lead snapped that it is not possible to have a network bug that only affect reading from a particular socket. The IT group insisted that there were no modifications to the production environment, all changed firewall rules in the last month were reviewed, and they couldn’t do that.

The CTO closed the meeting by quoting the damage that this downtime has done to the company, and directed everyone to investigate it further. No actual smoking gun could be found, and eventually the matter was dropped. One of the results of this change was an added emphasis on the production worthiness of all the parts of the system. Traces and logs were enhanced, circuit breakers were introduced and in general the team thought that they are pretty safe. The kernel trace fixed the problem, of course, but next time they will have a lot more information about what is going on.

Four months later…

The production issue that brought down the site was almost forgotten by this time, the system was running along happily for months, the changes to make the system more robust in production were already there, and everyone was happy.

Until the 3AM call on Thursday’s night. While driving back to work on empty roads, Jane had a strong sense of deja-vu. Again, the problem was that the system was hammering the database, again the log showed 100% cache misses. Again, there was no significant change to the production environment.

This time, the team already knew who the culprit was, and the caching system was given a thorough overview. No one could really find something wrong with it, but even more logging was added, and the change was pushed to production, where it didn’t seem to do any good at all.

Trying to ignore the CxO screaming match in the nearby conference room, the Infrastructure team tried to figure out what was wrong exactly. Jane thought that the problem was with the cache invalidation logic. The caching system used a fairly complex system to decide whatever a value in the cache was fresh enough or not.

Disabling that piece of the system was risking stale data scenarios, but stale data was better than no data. They commented that part out and push that to production. Unfortunately, it didn’t change one iota, and the system kept producing cache misses.

That was patently impossible, of course, but there was it. The IT group, in the meantime, came to the rescue. Trevor, the new guy on the team, decided to try deploying the application to a brand new server that was waiting to be provisioned. On the new server, the system worked, and that server did not have the kernel network trace installed.

Acting on instinct, they tried uninstalling the kernel network trace on one of the existing production servers. Like magic, that server came back to life and started working normally seconds after the reboot was completed. A rolling uninstallion of the magical kernel trace fixed the issue.

But this was being the second failure this year, and both could be traced to the same component. The development team was at a loss to explain what was going on there. For the next month or so, no developer dared walk by the executives part of the building. External consultants were brought in to do an in depth study of the code base, trying to find the problem. The consultants couldn’t really find anything to blame, but they didn’t trust the existing home grown cache servers. The company bought a commercial cache package, to the tune of 2,000 $ per CPU, replacing their caching backend.

For a while, it seemed like that would do it…

Jane woke up a few seconds before 3 AM, two months after the previous incident. It was Thursday again, and the phone was ringing. After briefly considering running away to the Sahara, she picked up the phone. It was the exact same scenario.

After arriving at the office, Jane didn’t bother to join the already violent row in the conference room, she sat down on her desk and brought up the Caching Module. She sat down and added a logging statement after each line in the codebase. Then she called Operations and had them push the new caching module to production.

That change didn’t fix the problem, but it gave Jane an exception. And that exception just wasn’t possible.

System.IndexOutOfRangeException: Index was outside the bounds of the array.
at System.Array.InternalGetReference(Void* elemRef, Int32 rank, Int32* pIndices)
at System.Array.GetValue(Int32 index)
at Northwind.CachingModule.CacheSelector.GetServer()
at Northwind.CachingModule.Cache.Get(string key)

That didn’t make any sort of sense, but at least she had a single method to check for.

private CacheServer GetServer()
{
if(aliveAndWellServes.Count == 0)
return null;
var server = aliveAndWellServes[Environment.TickCount % aliveAndWellServes.Length];
if(server.IsAlive == false)
{
aliveAndWellServes.Remove(server);
server.Dispose();
}
return server;
}

The idea was to spread the load between the cache servers, so there wouldn’t be a single cache server being hit repeatedly. Somehow, that method was failing, when it failed, it caused the caching system generic error handler to consider this as a downed cache server, and produce a cache miss.

Jane pushed another update to production, this time adding pervasive logging to the GetServer method. The output said it all.

Alive and well servers: 4
Tick count: -137538094
Server index: -2

Looking at the documentation of the Environment.TickCount, it all became clear. That method will return a negative number if the system has been running for over 25 days. When that happened, the cache implementation would fail, leading to overload on the database and closing the entire system down.

The reason that the error was patches meant that the servers were occasionally rebooted, so you had to wait until enough time passed since the last reboot. Installing and uninstalling the kernel trace resulted in a reboot, which temporarily fix the problem.

An interesting final tidbit about this error. No one mentioned to the executives that all source control systems come with a blame feature.

Dense code

time to read 1 min | 73 words

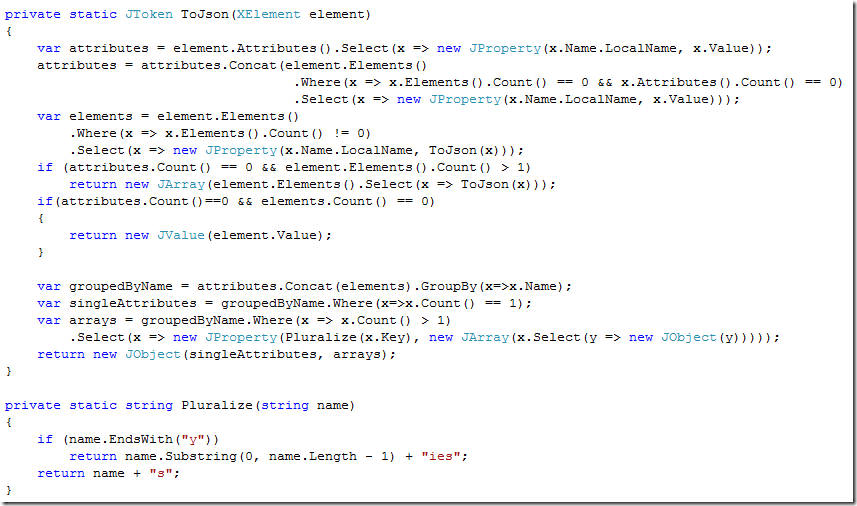
The amount of information that you can push into just a few lines of code keeps amazing me.

image

This is doing so much stuff that it is just creepy. And yes, it is quite elegant at the same time, since it is handling the required scenario in such a simple manner.

time to read 2 min | 345 words

If you head out to http://hibernatingrhinos.com/, you will see that I finally had the time to setup the corporate site. This is still very early, but I have a lot of content to add there, but it is a start.

Impleo, the CMS running the site, doesn’t have any web based interface, instead, it is built explicitly to take advantage of Windows Live Writer and similar tools. The “interface” for editing the site is the MetaWeblog API. This means that in order to edit the site, there isn’t any Wiki syntax to learn, or XML files to edit, or anything of this sort.

You have a powerful editor in your fingertips, one that properly handle things like adding images and other content. This turn the whole experience around. I usually find documentation boring, but I am used to writing in WLW, it is fairly natural to do, and it removes all the pain from the equation.

One of the things that I am trying to do with it is to setup a proper documentation repository for all my open source projects. This isn’t something new, and it is something that most projects have a hard time doing. I strongly believe in making things simple, in reducing friction. What I hope to do is to be able to accept documentation contributions from the community for the OSS projects.

I think that having a full fledged rich text editor in your hands is a game changer, compared to the usual way OSS handle documentation.  Take a look at what is needed to make this works, it should take three minutes to get started, no learning curve, no “how do they do this”.

So here is the deal, if you would like to contribute documentation (which can be anything that would help users with the projects), I just made things much easier for you. Please contact me directly and I’ll send you the credentials to be able to edit the site.

Thanks in advance for your support.

time to read 1 min | 119 words

Rob Conery and I had sat down and started recording a series of webcasts on NHibernate, which will show up on TekPub. TekPub is a paid service, and there are two NHibernate screen casts there already. We plan to have lots more.

I got a lot of requests for making my NHibernate courses available to a wider audience. And this is a way for you to get a ton of NHibernate content. So far the reactions that we got were very positive.

Oh, and as a side effect, you get to see NH Prof used by the person who wrote it, you might learn a thing or two about extracting information from the profiler.

FUTURE POSTS

  1. Partial writes, IO_Uring and safety - about one day from now
  2. Configuration values & Escape hatches - 5 days from now
  3. What happens when a sparse file allocation fails? - 7 days from now
  4. NTFS has an emergency stash of disk space - 9 days from now
  5. Challenge: Giving file system developer ulcer - 12 days from now

And 4 more posts are pending...

There are posts all the way to Feb 17, 2025

RECENT SERIES

  1. Challenge (77):
    20 Jan 2025 - What does this code do?
  2. Answer (13):
    22 Jan 2025 - What does this code do?
  3. Production post-mortem (2):
    17 Jan 2025 - Inspecting ourselves to death
  4. Performance discovery (2):
    10 Jan 2025 - IOPS vs. IOPS
View all series

Syndication

Main feed Feed Stats
Comments feed   Comments Feed Stats
}