Oren Eini

CEO of RavenDB

a NoSQL Open Source Document Database

Get in touch with me:

oren@ravendb.net +972 52-548-6969

Posts: 7,546
|
Comments: 51,161
Privacy Policy · Terms
filter by tags archive
time to read 2 min | 208 words

One of the nicest tools that you have as a developer is the ability to debug. WinDBG isn’t what I call the best debugger in the world, but it is certainly among the most powerful. This post is meant just to walk you through setting up WinDBG with a CoreCLR application.

In particular, this is important when you are getting a crash dump from somewhere. In order to actually debug things properly, you need to load the crash dump into WinDBG and then run the following commands:

  1. .sympath srv*c:\Symbols*https://msdl.microsoft.com/download/symbols
  2. .load C:\Program Files\dotnet\shared\Microsoft.NETCore.App\1.0.0\sos.dll .
  3. .reload

The first step is to setup the symbols, so you can see method names, instead of addresses. The second will use the CoreCLR SOS dll (note, if you have different versions, you might need to get the sos.dll from the machine that the user is running along with the dump). And finally you are reloading the symbols (this will be slow on the first time).

That is it, now you can start working with WinDBG relatively normally, although I did notice some some of the commands have better UI. Looks like SOS and SOSEX had a meeting Smile.

time to read 6 min | 1173 words

The Uber Engineering group have posted a really great blog post about their move from Postgres to MySQL. I mean that quite literally, it is a pleasure to read, especially since they went into such details as the on-disk format and the implications of that on their performance.

For fun, there is another great post from Uber, about moving from MySQL to Postgres, which also has interesting content.

Go ahead and read both, and we’ll talk when you are done. I want to compare their discussion to what we have been doing.

In general, Uber’s issue fall into several broad categories:

  • Secondary indexes cost on write
  • Replication format
  • The page cache vs. buffer pool
  • Connection handling

Secondary indexes

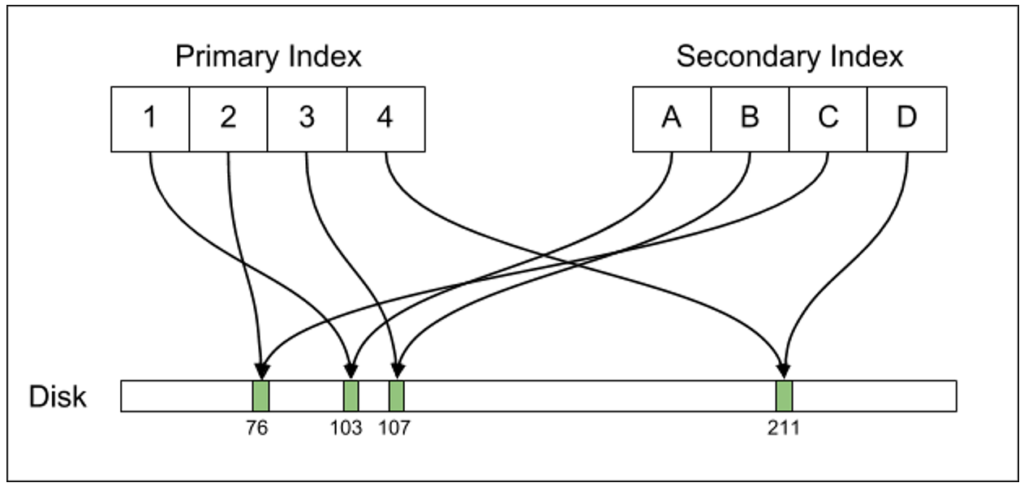
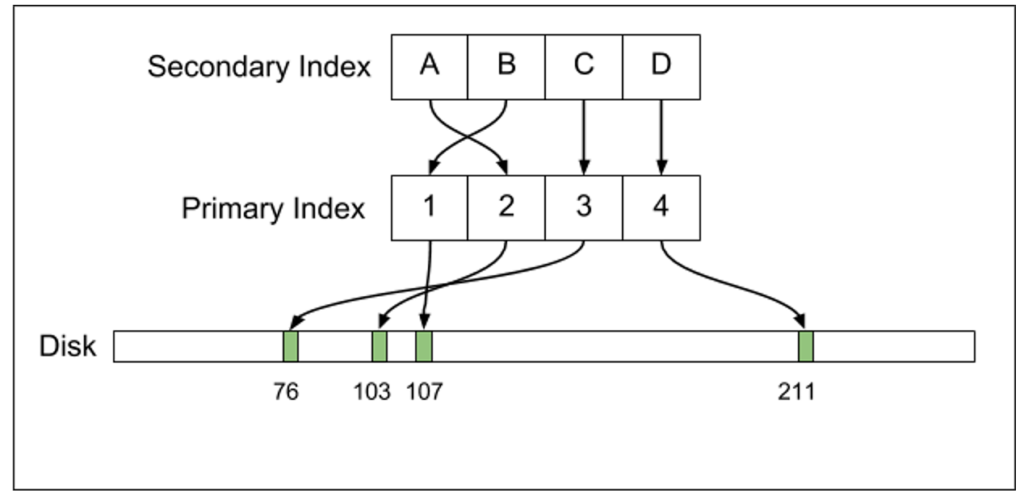
Postgres maintain a secondary index that points directly to the data on disk, while MySQL has a secondary index that has another level of indirection. The images show the difference quite clearly:

Postgres MySQL
Postgres_Tuple_Property_

MySQL_Index_Property_

I have to admit that this is the first time that I ever considered the fact that the indirection’s manner might have any advantage. In most scenarios, it will turn any scan on a secondary index into an O(N * logN) cost, and that can really hurt performance. With Voron, we have actually moved in 4.0 from keeping the primary key in the secondary index to keeping the on disk position, because the performance benefit was so high.

That said, a lot of the pain the Uber is feeling has to do with the way Postgres has implemented MVCC. Because they write new records all the time, they need to update all indexes, all the time, and after a while, they will need to do more work to remove the old version(s) of the record. In contrast, with Voron we don’t need to move the record (unless its size changed), and all other indexes can remain unchanged. We do that by having a copy on write and a page translation table, so while we have multiple copies of the same record, they are all in the same “place”, logically, it is just the point of view that changes.

From my perspective, that was the simplest thing to implement, and we get to reap the benefit on multiple fronts because of this.

Replication format

Postgres send the WAL over the wire (simplified, but easier to explain) while MySQL send commands. When we had to choose how to implement over the wire replication with Voron, we also sent the WAL. It is simple to understand, extremely robust and we already had to write the code to do that. Doing replication using it also allows us to exercise this code routinely, instead of it only running during rare crash recovery.

However, sending the WAL has issues, because it modify the data on disk directly, and issue there can cause severe problems (data corruption, including taking down the whole database). It is also extremely sensitive to versioning issues, and it would be hard if not impossible to make sure that we can support multiple versions replicating to one another. It also means that any change to the on disk format needs to be considered with distributed versioning in mind.

But what killed it for us was the fact that it is almost impossible to handle the scenario of replacing the master server automatically. In order to handle that, you need to be able to deterministically let the old server know that it is demoted and should accept no writes, and the new server that it can now accept writes and send its WAL onward. But if there is a period of time in which both can accept write, then you can’t really merge the WAL, and trying to is going to be really hard.  You can try using distributed consensus to run the WAL, but that is really expensive (about 400 writes / second in our benchmark, which is fine, but not great, and impose a high latency requirement).

So it is better to have a replication format that is more resilient to concurrent divergent work.

OS Page Cache vs Buffer Pool

From the post:

Postgres allows the kernel to automatically cache recently accessed disk data via the page cache. … The problem with this design is that accessing data via the page cache is actually somewhat expensive compared to accessing RSS memory. To look up data from disk, the Postgres process issues lseek(2) and read(2) system calls to locate the data. Each of these system calls incurs a context switch, which is more expensive than accessing data from main memory. … By comparison, the InnoDB storage engine implements its own LRU in something it calls the InnoDB buffer pool. This is logically similar to the Linux page cache but implemented in userspace. While significantly more complicated than Postgres’s design…

So Postgres is relying on the OS Page Cache, while InnoDB implements its own. But the problem isn’t with relying on the OS Page Cache, the problem is how you rely on it. And the way Postgres is doing that is by issuing (quite a lot, it seems) system calls to read the memory. And yes, that would be expensive.

On the other hand, InnoDB needs to do the same work as the OS, with less information, and quite a bit of complex code, but it means that it doesn’t need to do so many system calls, and can be faster.

Voron, on the gripping hand, relies on the OS Page Cache to do the heavy lifting, but generally issues very few system calls. That is because Voron memory map the data, so access it is usually a matter of just pointer dereference, the OS Page Cache make sure that the relevant data is in memory and everyone is happy. In fact, because we memory map the data, we don’t have to manage buffers for the system calls, or to do data copies, we can just serve the data directly. This ends up being the cheapest option by far.

Connection handling

Spawning a process per connection is something that I haven’t really seen since the CGI days. It seems pretty harsh to me, but it is probably nice to be able to kill a connection with a kill –9, I guess. Thread per connection is also something that you don’t generally see. The common situation today, and what we do with RavenDB, is to have a pool of threads that all manage multiple connections at the same time, often interleaving execution of different connections using async/await on the same thread for better performance.

time to read 5 min | 808 words

In the process of working on RavenDB 4.0, we are going over our code and looking for flaws. Both in the actual implementation and in the design of the API. The idea is to clear away the things that we know are bad in practice. And that leads us to today’s topic. Subscriptions.

Subscriptions are a way to ask RavenDB to give us, in a reliable way, all documents that match a certain criteria. Here is what the code looks like in RavenDB 3.5:

You typically write this in some form of background processing / job style. The key aspect here is that RavenDB is responsible for sending the data to the subscription, and making sure that you will not lose any updates. So the code is resilient for client errors, for connection errors, database restarts, etc.

However, the topic today isn’t actually subscriptions, it is their API. In practice, we noticed several deficiencies in the API above. To start with, the subscription actually started in an async manner, so opening the subscription and subscribing to it might actually be racy (it is possible to subscribe and start getting documents from the server before you attach your delegate to handle those documents). We had to write a bit of code to handle that scenario, and it was complex in the presence of adding / removing subscriptions when the subscription was live.

The other problem was that subscriptions are reliable. This means that if there is an error, the subscription will handle it. A disconnect from the server will automatically reconnect, and as far as the caller is concerned, nothing has really changed. It isn’t aware of any network errors or recovery that the subscription is doing.

Which is all well and good, until you realize that your connection string is wrong, and the subscription is going to forever retry to connect to the wrong location. We have a way to report errors to the caller code, but in most cases, the caller doesn’t care, the subscription is going to handle it anyway. So we have a problem. How do we balance both the need to handle errors and recover internally and let the caller know about our state?

We currently have the OnError() method we’ll call on the caller to let it know about any errors that we have, but that is not really helping it. The caller doesn’t have a good way to know if we can recover or not, and asking the caller to implement an error recovery policy is something that we don’t really want to do. This is complex and hard to do, and not something that the client should do.

What we ended up with is the following. First, we changed the API so you can’t just add / remove observers to a subscription. You create a new subscription, you attach all the observers that you want, and then you explicitly demarcate the stage in which the subscription starts. Having such an explicit stage frees us from the concurrency and race conditions that we previously had to handle. But it also gives us a chance to actually report something explicit to the calling code.

Let’s look at code, then discuss it:

The idea is that if you wait on the task returned from the StartAsync, which is very natural to do, you can tell whether the first time connection was successful or not. Then you can make determination on what to do next. If there is an error, you can dispose the subscription and report it upward, or you can let it recover automatically. This still doesn’t cover some scenarios, unfortunately. We also report all errors to the subscribers, which can make their own determination there.

The problem is that there are some errors that we just can’t recover from. If a user’s password has changed, eventually we’ll recycle the connection, and get an unauthorized error. There is nothing that the subscription can do to fix that, but at the same time, there is a very little chance for it to know that (a bad password is easy, a firewall rule blocking access is very hard to distinguish from the db being down, and in either case there is nothing that the subscription can do).

We are thinking about adding some sort of limit, something like if we retried for certain number of times, or for a certain duration, and couldn’t recover, we’ll report it through an event / method that must be registered (otherwise we’ll just throw it upward and maybe crash the process). The idea is that in this case, we need someone to pay attention, and an unhandled exception (if you didn’t register to catch it) would be appropriate.

I would like to get some feedback on the idea, before going ahead and implementing it.

time to read 3 min | 410 words

In my previous post, I discussed a problem in missing data over TCP connection that happened in a racy manner, only every few hundred runs. As it turns out, there is a simple way to make the code run into the problem every single time.

The full code for the repro can be found here.

Change these lines:

image

And voila, you will consistently run into the problem .  Wait, run that by me again, what is going on here?

As it turns out, the issue is in the server, more specifically, here and here. We use a StreamReader to read the first line from the client, do some processing, and then hand it to the ProcessConnection method, which also uses a StreamReader. More significantly, it uses a different StreamReader.

Why is that significant? Well, because of this, the StreamReader has buffers, by default, that are 1KB in size. So here is what happens in the case above: we send a single packet to the server, and when the first StreamReader reads from the stream, it fills the buffer with the two messages. But since there is a line break between them, when we call ReadLineAsync, we actually only get the first one.

Then, we when get to the ProcessConnection method, we have another StreamReader, which also reads from the stream, but the second message had already been read (and is waiting in the first StreamReader buffer), so we are waiting for more information from the client, which will never come.

So how come it sort of works if we do this in two separate calls? Well, it is all about the speed. In most cases, when we split it into two separate calls, the server socket has only the first message in there when the first StreamReader runs, so the second StreamReader is successful in reading the second line. But in some cases, the client manages being fast enough and sending both messages to the server before the server can read them, and voila, we have the same behavior, only much more unpredictable.

The key problem was that it wasn’t obvious we were reading too much from the stream, and until we figured that one out, we were looking in a completely wrong direction. 

time to read 3 min | 463 words

Occasionally, one of our tests hangs. Everything seems to be honky dory, but it just freezes and does not complete. This is a new piece of code, and thus is it suspicious unless proven otherwise, but an exhaustive review of it looked fine. It took over two days of effort to narrow it down, but eventually we managed to point the finger directly at this line of code:
image

In certain cases, this line would simply not read anything on the server. Even though the client most definitely sent the data. Now, given that TCP is being used, dropped packets might be expected. But we are actually testing on the loopback device, which I expect to be reliable.

We spent a lot of time investigating this, ending up with a very high degree of certainty that the problem was in the TCP stack somewhere. Somehow, on the loopback device, we were losing packets. Not always, and not consistently, but we were absolutely losing packets, which led the server to wait indefinitely for the client to send the message it already did.

Now, I’m as arrogant as the next developer, but even I don’t think I found that big a bug in TCP. I’m pretty sure that if it was this broken, I would have known about it. Beside, TCP is supposed to retransmit lost packets, so even if there were lost packets on the loopback device, we should have recovered from that.

Trying to figure out what was going on there sucked. It is hard to watch packets on the loopback device in WireShark, and tracing just told me that a message is sent from the client to the server, but the server never got it.

But we continued, and we ended up with a small reproduction of the issue. Here is the code, and my comments are below:

This code is pretty simple. It starts a TCP server, and listens to it, and then it reads and writes to the client. Nothing much here, I think you’ll agree.

If you run it, however, it will mostly work, except that sometimes (anywhere between 10 runs and 500 runs on my machine), it will just hang. I’ll save you some time and let you know that there are no dropped packets, TCP is working properly in this case. But the code just doesn’t. What is frustrating is that it is mostly working, it takes a lot of work to actually get it to fail.

Can you spot the bug? I’ll continue discussion of this in my next post.

time to read 2 min | 399 words

In my previous posts, I talked about tri state waiting, which included the following line:

image

And then I did a deep dive into how timers on the CLR are implemented. Taken together, this presents me somewhat of a problem. What is the cost of calling a Task.Delay? Luckily, the code is there, so we can check.

The relevant costs are here. We allocate a new DelayPromise, and a Timer instance. As we previously saw, actually creating a Timer instance will take a global lock, and the cost of actually firing those timers is proportional to the number of timers that we have.

Let’s consider the scenario for the code above. We want to support a very large number of clients, and we typically expect them to be idle, so every second we’ll have the delay fire, we send them a heartbeat, and go on with the waiting. What will happen in such a case for the code above?

All of those async connections are going to be allocating several objects per run, and each of them is going to contend on the same lock. All of them are also going to run a lot more slowly than they should.

In order to resolve this issue, given what we know now about the timer system on the CLR, we can write the following code:

In this case, we have a single static timer (so there is no lock contention per call), and we have a single task allocation per second. All of the connections will use the same instance. In other words, if there are 10,000 connections, we just saved 20K allocations per second, as well as 10K lock contentions, not to mention that instead of waking up every single connection one at a time, we have just a single task instance is completed once, resulting in all the the timing out tasks being woken up.

This code does have the disadvantage of allocating a task every second, even if no one is listening. It is a pretty small price to pay, and fixing it can be left as an exercise for the reader Smile.

time to read 3 min | 490 words

One of the coolest things about the CoreCLR being open sourced is that I can trawl through the source code and read random parts of the framework. One of the reasons to do this, is to be able to understand the implementation concerns, not just the design, which than allows us to produce a much better output.

In this case, I was investigating a hunch, and I found myself deep inside the code that runs the timers in .NET. The relevant code is here, and it is clearly commented as well as quite nice to read.

I’m just going to summarize a few interesting things I found in the code.

There is actually only one single real timer for the entire .NET process. I started out thinking this is handled via CreateTimerQueueTimer on Windows, but I couldn’t find a Linux implementation. Reading the code, the CLR actually implements this directly via this code. Simplified, it does the following:

image

This has some interesting implications. It means that timers are all going to be fired from the same thread, at the same time (not quite true, see below), and that there is likely going to be a problem with very long timers (a timer for three months from now will overflow int32, for example).

The list of timers is held in a linked list, and every time it is awakened, it runs through the list, finding the timer to trigger, and the next time to be triggered. The code in this code path is called with only a single timer, which is then used in the managed code for actually implementing the managed timers. It is important to note that actually running the timer callback is done by queuing that on the thread pool, not executing it on the timer thread.

On the managed side, there are some interesting comments explaining the expected usage and data structures used. There are two common cases, one is the use of timeout, in which case this is typically discarded before actual use, and the other is having the recurring timers, which tend to happen once in a long while. So the code favors adding / removing timers over actually finding which need to be executed.

Another thing to note is that this adding / removing / changing / iterating over timers is protected by a single lock. Every time the unmanaged timer wakes, it queue the callback on the thread pool, and then the FireNextTimers is called, which takes a look, iterates over all the timers, and queues all those timers to be executed on the thread pool.

This behavior is interesting, because it has some impact on commonly used cases. But I’ll discuss that on my next post.

time to read 3 min | 402 words

RavenDB has quite a bit of tests. Over five thousands of them, on the last count. They test common things (like saving a document works) and esoteric things (like spatial query behavior near the equator). They are important, but they also take quite a lot of time to run. In our current setup, running the full test suite can take 3 – 6 hours, depending on which build agent is running and what is the configuration we have.

This means that in terms of actually running the tests, developers can’t really get good feedback. We have taken some steps to address that, by creating a core set of tests that will examine the major and most important features, fast, which developers can run in reasonable time as part of their work, and then we let the build server sort out the pull requests on its own time.

For RavenDB 4.0, we decided to go in a different direction. We split the tests into two separate projects. FastTests and SlowTests. The requirement for the FastTest is that they will run in under 1 minute. In order to do that we use xunit’s parallel test support, which allows us to run concurrent tests (this actually required a lot of changes in the test code, which assumed that we are running in a serial fashion and that each test is the sole owner of the entire system).

Part of making sure that we are running in under 1 minute is knowing when we breached that. Because the tests run concurrently, it is a bit difficult to know what is taking so long. Thankfully, it is easy to get a report out. We use the following script to do that.

We now have the top slowest tests (some of them takes tens of seconds to run, but we don’t usually care, as long as other test run concurrently parallel and the whole suite is fast), and we can figure out whatever we can optimize the test or move it to the SlowTest project.

Another change we made was to move a lot of the test code to use the async API, this allows us to run more tests concurrently without putting too much of a burden on the system. Our current tests times range between 30 – 55 seconds, which is enough to run them pretty much on every drop of a hat.

time to read 4 min | 714 words

We recently had the need to develop a feature that requires a client to hold a connection to the server and listen to a certain event. Imagine that we are talking about a new document arriving to the database.

This led to a very simple design:

  • Open a TCP connection and let the server know about which IDs you care about.
  • Wait for any of those IDs to change.
  • Let the client know about it.

Effectively, it was:

Unfortunately, this simple design didn’t quite work. As it turns out, having a dedicated TCP connection per id is very expensive, so we would like to be able to use a single TCP connection in order to watch multiple documents. And we don’t know about all of them upfront, so we need to find a way to talk to the server throughout the process. Another issue that we have is the problem of steady state. If none of the documents we care about actually change for a long time, there is nothing going on over the network. This is going to lead the TCP connection to fail with a timeout.

Actually, a TCP connection that passes no packets is something that is perfectly fine in theory, but the problem is that it requires resource that that need to be maintained. As long as you have systems that are not busy, it will probably be fine, but the moment that it reaches the real world, the proxies / firewalls / network appliances along the way use a very brutal policy, “if I’m not seeing packets, I’m not maintaining the connection”, and it will be dropped, usually without even a RST packet. That makes debugging this sort of things interesting.

So our new requirements are:

  • Continue to accept IDs to watch throughout the lifetime of the connection.
  • Let the client know of any changes.
  • Make sure that we send the occasional heartbeat to keep the TCP connection alive.

This is much more fun to write, to be honest, and the code we ended up with was pretty, here it is:

There are a couple of things to note here. We are starting an async read operation from the TCP stream without waiting for it to complete, and then we go into a loop and wait for one of three options.

  1. A document that we watched has been changed (we are notified about that by the documentChanged task completion), in which case we notify the user. Note that we first replace the documentChanged task and then we drain the queue from all pending documents changes for this collection, after which we’ll go back to waiting. On the doc changed event, we first enqueue the document that was changed, and then complete the task. This ensure that we won’t miss anything.
  2. New data is available from the client. In this case we read it and add it to the IDs we are watching, while starting another async read operation (for which we’ll wait on the next loop iteration). I’m creating a new instance of the IDs collection here to avoid threading issues, and also because the number of items is likely to be very small and rarely change. If there were a lot of changes, I would probably go with a concurrent data structure, but I don’t think it is warranted at this time.
  3. Simple timeout.

Then, based on which task has been completed, we select the appropriate behavior (send message to client, accept new doc ID to watch, send heartbeat, etc).

The nice thing about this code is that errors are also handled quite nicely. If the client disconnects, we will get an error from the read, and know that it happened and exit gracefully (well, we might be getting that just when we are writing data to the client, but that is pretty much the same thing in terms of our error handling).

The really nice thing about this code is that for the common cases, where there isn’t actually anything for us to do except maintain the TCP connection, this code is almost never in runnable state, and we can support a very large number of clients with very few resources.

time to read 2 min | 369 words

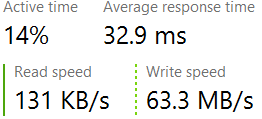
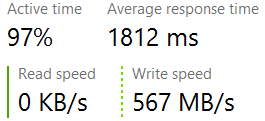
I’m currently in the process of getting some benchmark numbers for a process we have, and I was watching some metrics along the way. I have mentioned that disk’s speed can be effected by quite a lot of things. So here are two metrics, taken about 1 minute apart in the same benchmark.

This is using a Samsung PM871 512GB SSD drive, and it is currently running on a laptop, so not the best drive in the world, but certainly a respectable one.

Here is the steady state operation while we are doing a lot of write work. Note that the response time is very high, in computer terms, forever and a half:

image

And here is the same operation, but now we need to do some cleanup and push more data to the disk, in which case, we get great performance.

image

But oh dear good, just look at the latency numbers that we are seeing here.

Same machine, local hard disk (and SSD to boot), and we are seeing latency numbers that aren’t even funny.

In this case, the reason for this is that we are flushing the data file along side the journal file. In order to allow to to proceed as fast as possible, we try to parallelize the work so even though the data file flush is currently holding most of the I/O, we are still able to proceed with minimal hiccups and stall as far as the client is concerned.

But this can really bring home the fact that we are actually playing with a very limited pipe, and there little that we can do to control the usage of the pipe at certain points (a single fsync can flush a lot of unrelated stuff) and there is no way to throttle things and let the OS know (this particular flush operation should take more than 100MB/s, I’m fine with it taking a bit longer, as long as I have enough I/O bandwidth left for other stuff).

FUTURE POSTS

  1. Partial writes, IO_Uring and safety - about one day from now
  2. Configuration values & Escape hatches - 5 days from now
  3. What happens when a sparse file allocation fails? - 7 days from now
  4. NTFS has an emergency stash of disk space - 9 days from now
  5. Challenge: Giving file system developer ulcer - 12 days from now

And 4 more posts are pending...

There are posts all the way to Feb 17, 2025

RECENT SERIES

  1. Challenge (77):
    20 Jan 2025 - What does this code do?
  2. Answer (13):
    22 Jan 2025 - What does this code do?
  3. Production post-mortem (2):
    17 Jan 2025 - Inspecting ourselves to death
  4. Performance discovery (2):
    10 Jan 2025 - IOPS vs. IOPS
View all series

Syndication

Main feed Feed Stats
Comments feed   Comments Feed Stats
}