Oren Eini

CEO of RavenDB

a NoSQL Open Source Document Database

Get in touch with me:

oren@ravendb.net +972 52-548-6969

Posts: 7,546
|
Comments: 51,161
Privacy Policy · Terms
filter by tags archive
time to read 4 min | 603 words

As I mentioned, given a 45 GB file containing all the StackOverflow questions since 2008, I wanted to transform items like this:

Into this:

This turn out to be rather tricky to do. The file is sorted by the row id, but there are tricks here:

  • You can’t assume that all the answers to a question are located near the question itself.

Ideally, we could keep a dictionary of the questions and their answers until we have all the answers to the question, they write it all out. The problem here is that a question might have answered years after it was asked, which means that the answer id would place it very far from the question in the file, which means that we have to keep the question in memory for a very long time. In practice, this happens quite frequently, and it plays havoc with trying to limit the memory utilization for this approach.

  • While you would expect that answers will always have a row id that is higher than their questions, that isn’t always the case.

Let us take this question, about Haskell monads, which has the following answer.

The answer id is: 2388

The question id is: 44965

That means that if you scan the file sequentially, you are going to find the answers before their questions, somethings a lot before (I’m guessing that this happens if you have edits to a question, so a popular question might get edited long after it was asked & had answers).

The next thing I tried was to group all the questions together, then process them. Because I can’t do that in memory, I tried writing them to disk directly:

  • /questions/44965/q
  • /questions/44965/2388

The idea is that I can write them out to the file system, and then traverse the file system to gather all of them. The problem is that we are talking about over 32 million questions & answers, that isn’t really going to work for us using most normal file systems.

So I tried writing it all to a zip file, which was successful, but resulted in a zip file that was 21GB in size, and was very good in ensuring that nothing could open it before I run out of patience.

Eventually I just gave us and used Voron to handle it, here are the relevant sections:

image

Remember that Voron stores everything in a B+Tree, and allows to do ordered operations, so once this is done, all I need to do is traverse the tree, get all the records that have the same parent id, and voila, I have the grouping I wanted.

If I wanted to do it without the use of a database (or Voron), I would probably go with the following manner:

  • Read each entry from the source data, and write it to another file, noting its location.
  • Write “parent id, id, location” to a separate index file
  • Sort the index file.
  • Start reading from the index file as long as I have the same parent id, and merge those questions.

Why separate file? Because XmlReader does buffering, so it will be really hard to just in the file from just reading, by writing it out, we have the proper position to seek to.

Note that this will require a lot of random I/O, but that is pretty much just what it has to be.

time to read 2 min | 363 words

We are doing perf testing right now, and we are looking into real world datasets to play around with. Luckily for us, Stackoverflow have regular data dump of size significant enough to be useful for our experiments.

The file that I’m currently looking it is the Posts.xml file, which is about 45GB in size, and looks roughly like this (lot of stuff removed to make the point).

image

Since Stackoverflow is using relational database, their output is also relational. You can see that each element is a single row, and you have the ParentId in row #7 that points back to row #4.

Basically, row #4 is the question, and row #7 is one of the answers.

What I want it to take all of this data and move it into a more document format. In other words, what I want to have all the answers for a question contained within the question, something like this:

image

The fun part here is that this is a pretty big file, and we are writing the output into a GzipStream, so we don’t really have the option of saving / modifying midway through. Once we have written something out to the GzipStream, it cannot be changed.

So we need to find a way in which we can group all the answers under their questions, but at the same time, the file size is big, much bigger than the memory I have available, so we can’t just keep it all in memory and write it out in the end.

How would you solve this issue? My attempt is currently sitting at roughly 10GB of RAM used after processing about 30GB of XML, but I have to admit that I have thrown it together rather quickly, since I just needed the data and a quick & dirty solution is just fine here.

time to read 4 min | 750 words

Image result for team retrospectiveWe spent some time recently looking into a lot of our old design decisions. Some of them make very little sense today (json vs. blittalbe as a good example), but made perfect sense at the time, and were essential to actually getting the product out.
Some of those design decisions, however, are still something that I very firmly believe in.  This series of posts is going to explore those decisions, their background and how they played out in the real world. So, without further ado, let us talk about unbounded result sets.

The design of RavenDB was heavily influenced by my experience as That NHibernate Guy (I got started with NHibernate over a decade ago, if you can believe that), where I saw the same types of error, repeated over and over again. I then read Release It!, and I suddenly discovered that I wasn’t alone fighting those kind of demons. When I designed RavenDB, I set out explicitly to prevent as many of those as I possibly could.

One of the major issues that I wanted to address was Unbounded Result Sets, simply put, this is when you have:

SELECT * FROM OrderLines WHERE OrderID = 1555

And you don’t realize that this order has three million line items (or, which is worst, that most of your orders have a few thousands line items, so you are generating a lot of load on the database, only to throw most of them away).

In order to prevent this type of issue, RavenDB has the notion of mandatory page sizes.

  • On the client side, if you don’t specify a limit, we’ll implicitly add one (by default set to 128).
  • On the server side, there is a database wide maximum page size (by default set to 1024). The server will trim all page sizes to the max if they are larger.

I think that this is one of the more controversial decisions in RavenDB design, and one that got a lot of heated discussion. But I still think that this is a good idea,because I have seen what happens when you don’t do that.   And the arguments are mostly about “RavenDB should trust developers to know what they are doing” and a particular irate guy called me while I was out shopping to complain how I broke the sacred contract of Linq with regards to “queries should return all by default, even if this is ten billion results”. I pointed out that this is actually configurable, and if he wanted to set the default to any size he wanted, he could do that, but apparently it is supposed to be “shoot my own foot first, then think” kind of deal.

Even though that I still think that this is a really good idea, we have added some features over the years to make it easy for people to access the entire dataset when they need it. Streaming has been around since 2.5 or so, giving you a dedicated API to stream unbounded results. Streams were built to make it efficient to process large sets of data, and they allow both client & server to process the data in parallel, instead of batching huge responses on the server, then consuming ridiculous amounts of memory on the client before giving you the full result set. Instead, you can get each result as soon as it arrive from server, and you can process it and send it further.

In 4.0, we are going to change the behavior of the paging limits so:

  • If you don’t specify a limit, we’ll supply a limit clause of 25 items. If there are more than 25 items, we’ll throw an exception (unless you asked otherwise in the conventions).
  • If you supply a limit explicitly, it will work as expected and page through the data.

The idea is that we want to reduce the surprise for users, and that can give them the experience to draw upon early on. Another thing that we’ll do is make sure that the operations guys can also change that, likely with an environment variable or something like that. If you need to modify the conventions on the fly, you usually have hard time deploying a new version, and an immediate action is needed.

In this manner, we can help users avoid expensive requests to the server, and they can be explicit with what they need to do.

time to read 2 min | 310 words

One of the things that we have learned from supporting RavenDB in production is that you by default, everything is a black box into which you have exactly zero input. And in order to figure out what the problems are, you need to use expert tools (WinDBG or VM MAP for example) that are typically more focused on developers, and not usually available in production.

In RavenDB 4.0, we have started from the get go with the notion that everything we do must be exposed, tracked and monitored. Here is the results of the latest effort in that direction.

image

And:

image

There are several important things here. First, you can see that we are tracking the managed and unmanaged allocations that are happening in the system. More than that, we are now able to track down exactly which part of the system is responsible for that.

In the screenshots above, you can see that the UsageIpAndQuantity index has allocated about 65 MB of unmanaged memory, and that we have a few memory mapped files storing the data for index #3.

The idea is that we can now glance at this endpoint and tell very quickly what is going on. And this is something that can be done in production. In fact, that is something that we’ll expose in the studio so you can see those value change over time.

We are also waiting for the CoreCLR to expose the managed allocations on  a per thread basis, which will give us even better metrics.

time to read 4 min | 705 words

Controlling memory allocations is something that any performant service need to do. In RavenDB 4.0 we have taken that to heart, and most of our memory usage is manual, instead of relying on the GC.

Now, there are a lot of really good reasons to want to avoid manual memory management. We have decades of usage telling us that this is a hard problem, with some nasty issues associated with it. But when we are talking about performance different of orders of magnitude, I’ll accept that burden.

The first thing that we did when making this decision is to see if we can change the way we approach unmanaged memory management to make it easier to avoid all of the common issues. We made several decisions:

  • All native allocations must go through a context.
  • A context is a unit of work that is single threaded.
  • A context is bounded in scope.
  • A context is reusable.

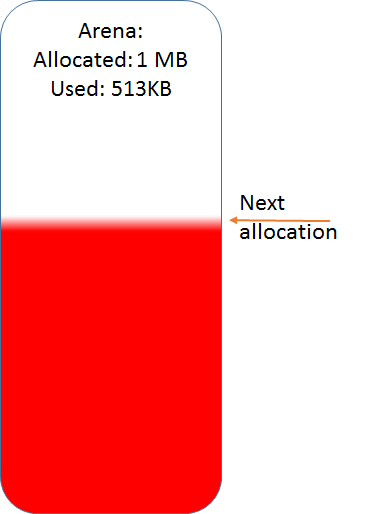
By placing those sort of limits on the native memory usage, we managed to gain a lot of simplicity. To start with, because the context is single threaded, we don’t have to implement an allocation strategy that is thread safe. Instead, we can just allocate a bunch of memory in the context, and parcel the memory from there. This looks like this:

image

The arena has allocated a certain size from the operation system. Allocating from that point is just a matter of bumping the next allocation pointer and handing that memory to the caller.

The nice thing about is that we don’t have the possibility for memory leaks, when the context scope ends, we can reset the next allocation pointer to the start, and we have “freed” all that memory. And we can start using it  again, without having to release it to the OS and get it back again. There are a whole bunch of edge cases (what happens when the arena is completely full, etc, but they are pretty obvious).

Not having to deal with multiple threads also present an interesting optimization. Once we are done with the memory, we can return it to the arena, but instead of maintaining free lists, etc, we do the following. If the returned memory is at the top of the arena (the last thing allocated), then we just bump the next allocation down, and the next allocation can reuse that memory. If that isn’t the case, we’ll do nothing, and rely on the context scope to handle this.

That, in turn, means that if I’m careful to free in the reverse order of allocations, I can get, within a single scope, memory reuse very cheaply. That is important, as we’ll see in a bit.

The context is also scoped to a certain operation, such as processing a request or an index batch. Because of that, even if we need to grow the arena, that is limited to however many operations we have to do inside that scope. And once the scope is over, we aren’t disposing of the context and releasing the memory, instead, we pool them so the next action will be able to use them. So a single OS level allocation is used across many actions, and the memory free cost is just setting a pointer.

But some scope need to do a lot of work, consider an index that is processing a big batch, in order to reduce the amount of memory that is being used, that is where the ability to free the top memory allocation comes in handy, because even inside the same scope, we can get memory reuse.

All in all, the allocation strategy was chosen to play to our strengths, and allow us to avoid doing multi threaded work in the hot paths, it also means that we get quite a lot of memory reuse, both within a scoped context and in different scopes, which reduce the overall amount of memory that we need to allocate. And the really great thing, it doesn’t come with a big pile of time spent in GC.

time to read 2 min | 221 words

Yesterday the perf team let me know that they managed to get ~18% improvement on Voron by utilizing another on disk data structure. I’ll post more on that when we have it merged and working.

Talking about this, we decided to run a few benchmarks on our current status.

Nitpicker – this post talks about the performance of low level storage engines, the benchmark used was storing sequential values with 8 bytes key and 8 bytes value.

Here are the results for writing a billion values (16 bytes total) in ten thousands transactions.

  • 1,000,000,000 values  (1 billion)
  • 9.13 minutes
  • 1.824 million writes / sec
  • 31 GB final size

Then we spiked a small optimization that should allow us to defer major I/O costs, and we got:

  • 100,000,000 values (hundred million)
  • 40 seconds
  • 2.449 million writes / sec
  • 4.1 GB final size

We pretty much cheat here, because we defer the I/O cost under load to a later time, by not purging the journals, but that is something that I’ll post in detail once we have this merged.

Oh, and those are the number before the additional 18% optimization Smile. And they were run on a single commodity hardware node over SSD drive.

time to read 2 min | 350 words

We recently started seeing a failing test in our RavenDB 4.0 test suite. This test was a relatively simple multi-map/reduce test.  Here it is:

image

I checked the history, and this test has been part of our test suite (and never failed us) since 2012. So I was a bit concerned when it started failing. Of course, it would only fail sometimes, which is the worst kind of failures.

After taking a deep breath and diving directly into the map/reduce implementation and figuring out all the parts that were touched by this test, I was stumped. Then I actually sat down and read through the test and tried to figure out what it is doing. This particular test is one that was sent by a user, so there was business logic to penetrate too.

The strange thing is that this test can never pass, it is inherently flawed, on several levels. To start with, it isn’t waiting for non stale results, which was the obvious racy issue. But once we fixed that, the test always failed. The problem is probably a copy/paste error. There supposed to be two lines for clients/1 and two lines for clients/2. But there are three lines for clients/1 and only one for clients/2. So this test should always fail.

But, because we didn’t have WaitForNonStaleResults, it will always return no results (it didn’t have time to finish indexing from the SaveChanges to the index) and the test would pass with empty result set.

This has been the case since 2012(!), mind you.

I fixed the copy/paste issue and the WaitForNonStaleResults, and the test consistently pass now.

The most interesting observation that I have here is that RavenDB is now able to run a full map/reduce cycle in the time it takes the test to move from the SaveChanges line to the query itself. And that is a damn impressive way to find bugs in your tests.

time to read 3 min | 531 words

I run into this article, talking about N+1 issues from a “fresh” perspective. In the article, there is a quote by DHH there that goes like this:

If you have N+1 query it means you’re executing one SQL query per element so if you have 50 emails in an inbox, that’d be 50 SQL calls, right? That sounds like a bug. Well in a Russian doll caching setup, it’s not a bug, it’s a feature. The beauty of those individual calls are that they’re individually cached, on their own timeline, and that they’re super simple.

Now, I have been involved with OR/Ms and databases for over a decade now, and I have spent large parts of my career working to resolve performance problems in database driven applications.

In a word, the idea that having a larger amount of simpler queries is better is nonsense. In particular, it completely ignores the cost of going to the database. Sure, a more complex query may require the database to do additional work, and if you are using caching, then you’ll not have the data in the cache in neat “cache entry per row”. But in practice, this leads to applications doing hundreds of queries per page view, absolute reliance on the cache and tremendous cost at startup.

In RavenDB, most queries are so fast that when we measured, the network component was the largest cost we had to face.

Let us do the numbers, shall we? Let us assume that we are talking about the best case, we have the database machine and the web machine in the same datacenter. Cost of roundtrip in the same datacenter is 0.5 ms. Now, let us go back to the 50 emails example above, shall we? We need to send 50 queries to the database. We’ll assume that we have a perfect database that takes no time at all to answer. That is still 25 ms wasted just on roundtrip times.

And the problem is that this is usually a lot more than 50 queries per page when you adopt this kind of silliness. You typically see hundreds or thousands of them, and the database isn’t really able to answer you in no time, so expect to see much bigger delays in practice.

But wait, I hear you say, this is all about caching, you are ignoring that part. Well, no, I’m not. If you are using a distributed cache, the costs over the network are exactly the same. So this is only relevant if you are using a cache on the same server, but then you run into issues when you have different caches on different machines hold different information. Not to mention that you are now in the wonderful world of having to worry about cache invalidation strategies and aligning them with the business requirements.

And for fun, what happens one of your cache nodes goes down? You got it, you just created a DoS attach on your own database.

On the other hand, you can actually create proper queries, get the data in as few roundtrips as possible and trust the database engine to do its work.

time to read 1 min | 155 words

It’s that time again, we are looking for more people to work on RavenDB. I’m going to assume that if you are reading this, you know what we do, so I’ll skip telling you how exciting, dynamic and buzzword of the day this position is. I’ll say that we are doing a lot of fun things, one of our guys just finished taking us from 200 req/sec in a particular scenario to 30,000 req/sec, for example Smile.

We are looking for someone who can build system software in C#, with really good understanding of the way computers work, and how to get the best out of them. If you have OSS contributions, that puts you at the head of the line.

Just ping us at jobs@ravendb.net with your CV.

This position is for Hadera, Israel, and is not available for remote work.

time to read 3 min | 486 words

I talked about the goals of using diffs for the journals in a previous post, but in this one, I want to talk about what it actually did. To start with, it turn out that using diffs in the journal invalidates quite a few optimizations that we had. We had a whole bunch of stuff that we could do to avoid writing data to the data file if there are additional modifications to it. When using diffs, we can’t do that, because the next diff is building on the previous version. That actually ended up improving the code quality, because a bunch of pretty tricky code had to go away.

It was tricky code because we tried to reduce the data file I/O, but only in the cases that it was allowed, which wasn’t always. Now we always write the latest version of all the modified pages, which might add some additional I/O in some cases, but in practice, this didn’t show up in our benchmarks. And the reduction of complexity might have been worth it even if it was.

We actually have two diff implementation, one that tests two different versions of a page and find the differences, and one that test a page against zeros. That, in addition to collapsing runs of zeros, is the entire implementation. We are actually not as small as we could get, because we insert some metadata into the diff stream to allow easier debugging and error detection. But the nice thing about the diff output is that we are still compressing it, so working extra hard to reduce the uncompressed data isn’t that important if compression will cover it anyway.

We tested before & after of using diffs for journal writes, and we found the following:

Journal size (inserts) 37% reduction in size
Journal size (updates) 80% reduction in size
Bulk insert speed 5% – 10% speed improvement *
Writes / sec (inserts) 12% improvement
Writes / sec (updates) 18% improvement

* If the sizes went down so significantly, why haven’t the insert & update speed improve by a comparable amount?

The answer to that is that for the most part, reducing the amount of data we are writing is awesome, a major limiting factor is the number of times we write to the journal, rather than the number of bytes. And we have to write once per transaction, so that is a limiting factor.

However, the current numbers we are looking at is a benchmark showing roughly 30,000 write requests / second and are unable to get anything higher, because we have saturated the local network. We are currently setting up a dedicated testing environment to see how far we can push this.

FUTURE POSTS

  1. Partial writes, IO_Uring and safety - about one day from now
  2. Configuration values & Escape hatches - 5 days from now
  3. What happens when a sparse file allocation fails? - 7 days from now
  4. NTFS has an emergency stash of disk space - 9 days from now
  5. Challenge: Giving file system developer ulcer - 12 days from now

And 4 more posts are pending...

There are posts all the way to Feb 17, 2025

RECENT SERIES

  1. Challenge (77):
    20 Jan 2025 - What does this code do?
  2. Answer (13):
    22 Jan 2025 - What does this code do?
  3. Production post-mortem (2):
    17 Jan 2025 - Inspecting ourselves to death
  4. Performance discovery (2):
    10 Jan 2025 - IOPS vs. IOPS
View all series

Syndication

Main feed Feed Stats
Comments feed   Comments Feed Stats
}