When we build a new feature in RavenDB, we either have at least some idea about what we want to build or we are doing something that is pure speculation. In either case, we will usually spend only a short amount of time trying to plan ahead.
A good example of that can be found in my RavenDB 7.1 I/O posts, which cover about 6+ months of work for a major overhaul of the system. That was done mostly as a series of discussions between team members, guidance from the profiler, and our experience, seeing where the path would lead us. In that case, it led us to a five-fold performance improvement (and we’ll do better still by the time we are done there).
That particular set of changes is one of the more complex and hard-to-execute changes we have made in RavenDB over the past 5 years or so. It touched a lot of code, it changed a lot of stuff, and it was done without any real upfront design. There wasn’t much point in designing, we knew what we wanted to do (get things faster), and the way forward was to remove obstacles until we were fast enough or ran out of time.
I re-read the last couple of paragraphs, and it may look like cowboy coding, but that is very much not the case. There is a process there, it is just not something we would find valuable to put down as a formal design document. The key here is that we have both a good understanding of what we are doing and what needs to be done.
RavenDB 4.0 design document
The design document we created for RavenDB 4.0 is probably the most important one in the project’s history. I just went through it again, it is over 20 pages of notes and details that discuss the current state of RavenDB at the time (written in 2015) and ideas about how to move forward.
It is interesting because I remember writing this document. And then we set out to actually make it happen, that wasn’t a minor update. It took close to three years to complete the process, to give you some context about the complexity and scale of the task.
To give some further context, here is an image from that document:
And here is the sharding feature in RavenDB right now:
This feature is called prefixed sharding in our documentation. It is the direct descendant of the image from the original 4.0 design document. We shipped that feature sometime last year. So we are talking about 10 years from “design” to implementation.
I’m using “design” in quotes here because when I go through this v4.0 design document, I can tell you that pretty much nothing that ended up in that document was implemented as envisioned. In fact, most of the things there were abandoned because we found much better ways to do the same thing, or we narrowed the scope so we could actually ship on time.
Comparing the design document to what RavenDB 4.0 ended up being is really interesting, but it is very notable that there isn’t much similarity between the two. And yet that design document was a fundamental part of the process of moving to v4.0.
What Are Design Documents?
A classic design document details the architecture, workflows, and technical approach for a software project before any code is written. It is the roadmap that guides the development process.
For RavenDB, we use them as both a sounding board and a way to lay the foundation for our understanding of the actual task we are trying to accomplish. The idea is not so much to build the design for a particular feature, but to have a good understanding of the problem space and map out various things that could work.
Recent design documents in RavenDB
I’m writing this post because I found myself writing multiple design documents in the past 6 months. More than I have written in years. Now that RavenDB 7.0 is out, most of those are already implemented and available to you. That gives me the chance to compare the design process and the implementation with recent work.
Vector Search & AI Integration for RavenDB
This was written in November 2024. It outlines what we want to achieve at a very high level. Most importantly, it starts by discussing what we won’t be trying to do, rather than what we will. Limiting the scope of the problem can be a huge force multiplier in such cases, especially when dealing with new concepts.
Reading throughout that document, it lays out the external-facing aspect of vector search in RavenDB. You have the vector.search() method in RQL, a discussion on how it works in other systems, and some ideas about vector generation and usage.
It doesn’t cover implementation details or how it will look from the perspective of RavenDB. This is at the level of the API consumer, what we want to achieve, not how we’ll achieve it.
AI Integration with RavenDB
Given that we have vector search, the next step is how to actually get and use it. This design document was a collaborative process, mostly written during and shortly after a big design discussion we had (which lasted for hours).
The idea there was to iron out the overall understanding of everyone about what we want to achieve. We considered things like caching and how it plays into the overall system, there are notes there at the level of what should be the field names.
That work has already been implemented. You can access it through the new AI button in the Studio. Check out this icon on the sidebar:
That was a much smaller task in scope, but you can see how even something that seemed pretty clear changed as we sat down and actually built it. Concepts we didn’t even think to consider were raised, handled, and implemented (without needing another design).
Voron HSNW Design Notes
This design document details our initial approach to building the HSNW implementation inside Voron, the basis for RavenDB’s new vector search capabilities.
That one is really interesting because it is a pure algorithmic implementation, completely internal to our usage (so no external API is needed), and I wrote it after extensive research.
The end result is similar to what I planned, but there are still significant changes. In fact, pretty much all the actual implementation details are different from the design document. That is both expected and a good thing because it means that once we dove in, we were able to do things in a better way.
Interestingly, this is often the result of other constraints forcing you to do things differently. And then everything rolls down from there.
“If you have a problem, you have a problem. If you have two problems, you have a path for a solution.”
In the case of HSNW, a really complex part of the algorithm is handling deletions. In our implementation, there is a vector, and it has an associated posting list attached to it with all the index entries. That means we can implement deletion simply by emptying the associated posting list. An entire section in the design document (and hours spent pondering) is gone, just like that.
If the design document doesn’t reflect the end result of the system, are they useful?
I would unequivocally state that they are tremendously useful. In fact, they are crucial for us to be able to tackle complex problems. The most important aspect of design documents is that they capture our view of what the problem space is.
Beyond their role in planning, design documents serve another critical purpose: they act as a historical record. They capture the team’s thought process, documenting why certain decisions were made and how challenges were addressed. This is especially valuable for a long-lived project like RavenDB, where future developers may need context to understand the system’s evolution.
Imagine a design document that explores a feature in detail—outlining options, discussing trade-offs, and addressing edge cases like caching or system integrations. The end result may be different, but the design document, the feature documentation (both public and internal), and the issue & commit logs serve to capture the entire process very well.
Sometimes, looking at the road not taken can give you a lot more information than looking at what you did.
I consider design documents to be a very important part of the way we design our software. At the same time, I don’t find them binding, we’ll write the software and see where it leads us in the end.
What are your expectations and experience with writing design documents? I would love to hear additional feedback.
Update: 2026-07-13 - I originally wrote this in early 2025 intended for RavenDB 7.1. It turns out that we got higher priorities (a whole new set of AI features) that pushed this to RavenDB 8.0.
I have been delaying the discussion about the performance numbers for a reason. Once we did all the work that I described in the previous posts, we put it to an actual test and ran it against the benchmark suite. In particular, we were interested in the following scenario:
High insert rate, with about 100 indexes active at the same time. Target: Higher requests / second, lowered latency
Previously, after hitting a tipping point, we would settle at under 90 requests/second and latency spikes that hit over 700(!) ms. That was the trigger for much of this work, after all. The initial results were quite promising, we were showing massive improvement across the board, with over 300 requests/second and latency peaks of 350 ms.
On the one hand, that is a really amazing boost, over 300% improvement. On the other hand, just 300 requests/second - I hoped for much higher numbers. When we started looking into exactly what was going on, it became clear that I seriously messed up.
Under load, RavenDB would issue fsync() at a rate of over 200/sec. That is… a lot, and it means that we are seriously limited in the amount of work we can do. That is weird since we worked so hard on reducing the amount of work the disk has to do. Looking deeper, it turned out to be an interesting combination of issues.
Whenever Voron changes the active journal file, we’ll register the new journal number in the header file, which requires an fsync() call. Because we are using shared journals, the writes from both the database and all the indexes go to the same file, filling it up very quickly. That meant we were creating new journal files at a rate of more than one per second. That is quite a rate for creating new journal files, mostly resulting from the sheer number of writes that we funnel into a single file.
The catch here is that on each journal file creation, we need to register each one of the environments that share the journal. In this case, we have over a hundred environments participating, and we need to update the header file for each environment. With the rate of churn that we have with the new shared journal mode, that alone increases the number of fsync() generated.
It gets more annoying when you realize that in order to actually share the journal, we need to create a hard link between the environments. On Linux, for example, we need to write the following code:
You need to make 4 system calls to do this properly, and most crucially, one of them is fsync() on the destination directory. This is required because the man page states:
Calling fsync() does not necessarily ensure that the entry in the directory containing the file has also reached disk. For that an explicit fsync() on a file descriptor for the directory is also needed.
Shared journals mode requires that we link the journal file when we record a transaction from that environment to the shared journal. In our benchmark scenario, that means that each second, we’ll write from each environment to each journal. We need an fsync() for the directory of each environment per journal, and in total, we get to over 200 fsync() per journal file, which we replace at a rate of more than one per second.
Doing nothing as fast as possible…
Even with this cost, we are still 3 times faster than before, which is great, but I think we can do better. In order to be able to do that, we need to figure out a way to reduce the number of fsync() calls being generated. The first task to handle is updating the file header whenever we create a new journal.
We are already calling fsync() on the directory when we create the journal file, so we ensure that the file is properly persisted in the directory. There is no need to also record it in the header file. Instead, we can just use the directory listing to handle this scenario. That change alone saved us about 100 fsync() / second.
The second problem is with the hard links, we need to make sure that these are persisted. But calling fsync() for each one is cost-prohibitive. Luckily, we already have a transactional journal, and we can re-use that. As part of committing a set of transactions to the shared journal, we’ll also record an entry in the journal with the associated linked paths.
That means we can skip calling fsync() after creating the hard link, since if we run into a hard crash, we can recover the linked journals during the journal recovery. That allows us to skip the other 100 fsync() / second.
Another action we can take to reduce costs is to increase the size of the journal files. Since we are writing entries from both the database and indexes to the same file, we are going through them a lot faster now, so increasing the default maximum size will allow us to amortize the new file costs across more transactions.
The devil is in the details
The idea of delaying the fsync() of the parent directory of the linked journals until recovery is a really great one because we usually don’t recover. That means we delay the cost indefinitely, after all. Recovery is rare, and adding a few milliseconds to the recovery time is usually not meaningful.
However… There is a problem when you look at this closely. The whole idea behind shared journals is that transactions from multiple storage environments are written to a single file, which is hard-linked to multiple directories. Once written, each storage environment deals with the journal files independently.
That means that if the root environment is done with a journal file and deletes it before the journal file hard link was properly persisted to disk and there was a hard crash… on recovery, we won’t have a journal to re-create the hard links, and the branch environments will be in an invalid state.
That is a set of circumstances that is going to be unlikely, but that is something that we have to prevent, nevertheless.
The solution for that is to keep track of all the journal directories, and whenever we are about to delete a journal file, we’ll sync all the associated journal directories. The key here is that when we do that, we keep track of the current journal written to that directory. Instead of having to run fsync() for each directory per journal file, we can amortize this cost. Because we delayed the actual syncing, we have time to create more journal files, so calling fsync() on the directory ensures that multiple files are properly persisted.
We still have to sync the directories, but at least it is not to the tune of hundreds of times per second.
Performance results
After making all of those changes, we run the benchmark again. We are looking at over 500 req/sec and latency peaks that hover around 100 ms under load. As a reminder, that is almost twice as much as the improved version (and a hugeimprovement in latency).
If we compare this to the initial result, we increased the number of requests per second by over 500%.
But I have some more ideas about that, I’ll discuss them in the next post…
Update: 2026-07-13 - I originally wrote this in early 2025 intended for RavenDB 7.1. It turns out that we got higher priorities (a whole new set of AI features) that pushed this to RavenDB 8.0.
I wrote before about a surprising benchmark that we ran to discover the limitations of modern I/O systems. Modern disks such as NVMe have impressive capacity and amazing performance for everyday usage. When it comes to the sort of activities that a database engine is interested in, the situation is quite different.
At the end of the day, a transactional database cares a lot about actually persisting the data to disk safely. The usual metrics we have for disk benchmarks are all about buffered writes, that is why we run our own benchmark. The results were really interesting (see the post), basically, it feels like there is a bottleneck writing to the disk. The bottleneck is with the number of writes, not how big they are.
If you are issuing a lot of small writes, your writes will contend on that bottleneck and you’ll see throughput that is slow. The easiest way to think about it is to consider a bus carrying 50 people at once versus 50 cars with one person each. The same road would be able to transport a lot more people with the bus rather than with individual cars, even though the bus is heavier and (theoretically, at least) slower.
Databases & Storages
In this post, I’m using the term Storage to refer to a particular folder on disk, which is its own self-contained storage with its own ACID transactions. A RavenDB database is composed of many such Storages that are cooperating together behind the scenes.
The I/O behavior we observed is very interesting for RavenDB. The way RavenDB is built is that a single database is actually made up of a central Storage for the data, and separate Storages for each of the indexes you have. That allows us to do split work between different cores, parallelize work, and most importantly, benefit from batching changes to the indexes.
The downside of that is that a single transaction doesn’t cause a single write to the disk but multiple writes. Our test case is the absolute worst-case scenario for the disk, we are making a lot of individual writes to a lot of documents, and there are about 100 indexes active on the database in question.
In other words, at any given point in time, there are many (concurrent) outstanding writes to the disk. We don’t actually care about most of those writers, mind you. The only writer that matters (and is on the critical path) is the database one. All the others are meant to complete in an asynchronous manner and, under load, will actually perform better if they stall (since they can benefit from batching).
The problem is that we are suffering from this situation. In this situation, the writes that the user is actually waiting for are basically stuck in traffic behind all the lower-priority writes. That is quite annoying, I have to say.
The role of the Journal in Voron
The Write Ahead Journal in Voron is responsible for ensuring that your transactions are durable. I wrote about it extensively in the past (in fact, I would recommend the whole series detailing the internals of Voron). In short, whenever a transaction is committed, Voron writes that to the journal file using unbuffered I/O.
Remember that the database and each index are running their own separate storages, each of which can commit completely independently of the others. Under load, all of them may issue unbuffered writes at the same time, leading to congestion and our current problem.
During normal operations, Voron writes to the journal, waits to flush the data to disk, and then deletes the journal. They are never actually read except during startup. So all the I/O here is just to verify that, on recovery, we can trust that we won’t lose any data.
The fact that we have many independent writers that aren’t coordinating with one another is an absolute killer for our performance in this scenario. We need to find a way to solve this, but how?
One option is to have both indexes and the actual document in the same storage. That would mean that we have a single journal and a single writer, which is great. However, Voron has a single writer model, and for very good reasons. We want to be able to process indexes in parallel and in batches, so that was a non-starter.
The second option was to not write to the journal in a durable manner for indexes. That sounds… insane for a transactional database, right? But there is logic to this madness. RavenDB doesn’t actually need its indexes to be transactional, as long as they are consistent, we are fine with “losing” transactions (for indexes only, mind!). The reasoning behind that is that we can re-index from the documents themselves (who would be writing in a durable manner).
We actively considered that option for a while, but it turned out that if we don’t have a durable journal, that makes it a lot more difficult to recover. We can’t rely on the data on disk to be consistent, and we don’t have a known good source to recover from. Re-indexing a lot of data can also be pretty expensive. In short, that was an attractive option from a distance, but the more we looked into it, the more complex it turned out to be.
The final option was to merge the journals. Instead of each index writing to its own journal, we could write to a single shared journal at the database level. The problem was that if we did individual writes, we would be right back in the same spot, now on a single file rather than many. But our tests show that this doesn’t actually matter.
Luckily, we are well-practiced in the notion of transaction merging, so this is exactly what we did. Each storage inside a database is completely independent and can carry on without needing to synchronize with any other. We defined the following model for the database:
Root Storage: Documents
Branch: Index - Users/Search
Branch: Index - Users/LastSuccessfulLogin
Branch: Index - Users/Activity
This root & branch model is a simple hierarchy, with the documents storage serving as the root and the indexes as branches. Whenever an index completes a transaction, it will prepare the journal entry to be written, but instead of writing the entry to its own journal, it will pass the entry to the root.
The root (the actual database, I remind you) will be able to aggregate the journal entries from its own transaction as well as all the indexes and write them to the disk in a single system call. Going back to the bus analogy, instead of each index going to the disk using its own car, they all go on the bus together.
We now write all the entries from multiple storages into the same journal, which means that we have to distinguish between the different entries. I wrote a bit about the challenges involved there, but we got it done.
The end result is that we now have journal writes merging for all the indexes of a particular database, which for large databases can reduce the total number of disk writes significantly. Remember our findings from earlier, bigger writes are just fine, and the disk can process them at GB/s rate. It is the number of individual writes that matters most here.
Writing is not even half the job, recovery (read) in a shared world
The really tough challenge here wasn’t how to deal with the write side for this feature. Journals are never read during normal operations. Usually we only ever write to them, and they keep a persistent record of transactions until we flush all changes to the data file, at which point we can delete them.
It is only when the Storage starts that we need to read from the journals, to recover all transactions that were committed to them. As you can imagine, even though this is a rare occurrence, it is one of critical importance for a database.
This change means that we direct all the transactions from both the indexes and the database into a single journal file. Usually, each Storage environment has its own Journals/ directory that stores its journal files. On startup, it will read through all those files and recover the data file.
How does it work in the shared journal model? For a root storage (the database), nothing much changes. We need to take into account that the journal files may contain transactions from a different storage, such as an index, but that is easy enough to filter.
What about branch storage (an index) recovery? Well, it can probably just read the Journals/ directory of the root (the database), no?
Well, maybe. Here are some problems with this approach. How do we encode the relationship between root & branch? Do we store a relative path, or an absolute path? We could of course just always use the root’s Journals/ directory, but that is problematic. It means that we could only open the branch storage if we already have the root storage open. Accepting this limitation means adding a new wrinkle into the system that currently doesn’t exist.
It is highly desirable (for many reasons) to want to be able to work with just a single environment. For example, for troubleshooting a particular index, we may want to load it in isolation from its database. Losing that ability, which ties a branch storage to its root, is not something we want.
The current state, by the way, in which each storage is a self-contained folder, is pretty good for us. Because we can play certain tricks. For example, we can stop a database, rename an index folder, and start it up again. The index would be effectively re-created. Then we can stop the database and rename the folders again, going back to the previous state. That is not possible if we tie all their lifetimes together with the same journal file.
Additional complexity is not welcome in this project
Building a database is complicated enough, adding additional levels of complexity is a Bad Idea. Adding additional complexity to the recovery process (which by its very nature is both critical and rarely executed) is a Really Bad Idea.
I started laying out the details about what this feature entails:
A database cannot delete its journal files until all the indexes have synced their state.
What happens if an index is disabled by the user?
What happens if an index is in an error state?
How do you manage the state across snapshot & restore?
There is a well-known optimization for databases in which we split the data file and the journal files into separate volumes. How is that going to work in this model?
Putting the database and indexes on separate volumes altogether is also a well-known optimization technique. Is that still possible?
How do we migrate from legacy databases to the new shared journal model?
I started to provide answers for all of these questions… I’ll spare you the flow chart that was involved, it looked something between abstract art and the remains of a high school party.
The problem is that at a very deep level, a Voron Storage is meant to be its own independent entity, and we should be able to deal with it as such. For example, RavenDB has a feature called Side-by-Side indexes, which allows us to have two versions of an index at the same time. When both the old and new versions are fully caught up, we can shut down both indexes, delete the old one, and rename the new index with the old one’s path.
A single shared journal would have to deal with this scenario explicitly, as well as many other different ones that all made such assumptions about the way the system works.
Not my monkeys, not my circus, not my problem
I got a great idea about how to dramatically simplify the task when I realized that a core tenet of Voron and RavenDB in general is that we should not go against the grain and add complexity to our lives. In the same way that Voron uses memory-mapped files and carefully designed its data access patterns to take advantage of the kernel’s heuristics.
The idea is simple, instead of having a single shared journal that is managed by the database (the root storage) and that we need to access from the indexes (the branch storages), we’ll have a single shared journal with many references.
The idea is that instead of having a single journal file, we’ll take advantage of an interesting feature: hard links. A hard link is just a way to associate the same file data with multiple file names, which can reside in separate directories. A hard link is limited to files running on the same volume, and the easiest way to think about them is as pointers to the file data.
Usually, we make no distinction between the file name and the file itself, but at the file system level, we can attach a single file to multiple names. The file system will manage the reference counts for the file, and when the last reference to the file is removed, the file system will delete the file.
The idea is that we’ll keep the same Journals/ directory structure as before, where each Storage has its own directory. But instead of having separate journals for each index and the database, we’ll have hard links between them. You can see how it will look like here, the numbers next to the file names are the inode numbers, you can see that there are multiple such files with the same inode number (indicating that there are multiple links to the same underlying file)..
With this idea, here is how a RavenDB database manages writing to the journal. When the database needs to commit a transaction, it will write to its journal, located in the Journals/ directory. If an index (a branch storage) needs to commit a transaction, it does not write to its own journal but passes the transaction to the database (the root storage), where it will be merged with any other writes (from the database or other indexes), reducing the number of write operations.
The key difference here is that when we write to the journal, we check if that journal file is already associated with this storage environment. Take a look at the Journals/0015.journal file, if the Users_ByName index needs to write, it will check if the journal file is already associated with it or not. In this case, you can see that Journals/0015.journal points to the same file (inode) as Indexes/Users_ByName/Journals/0003.journal.
What this means is that the shared journals mode is only applicable for committing transactions, there have been no changes required for the reads / recovery side. That is a major plus for this sort of a critical feature since it means that we can rely on code that we have proven to work over 15 years.
The single writer mode makes it work
A key fact to remember is that there is always only a single writer to the journal file. That means that there is no need to worry about contention or multiple concurrent writes competing for access. There is one writer and many readers (during recovery), and each of them can treat the file as effectively immutable during recovery.
The idea behind relying on hard links is that we let the operating system manage the file references. If an index flushes its file and is done with a particular journal file, it can delete that without requiring any coordination with the rest of the indexes or the database. That lack of coordination is a huge simplification in the process.
In the same manner, features such as copying & moving folders around still work. Moving a folder will not break the hard links, but copying the folder will. In that case, we don’t actually care, we’ll still read from the journal files as normal. When we need to commit a new transaction after a copy, we’ll create a new linked file.
That means that features such as snapshots just work (although restoring from a snapshot will create multiple copies of the “same” journal file). We don’t really care about that, since in short order, the journals will move beyond that and share the same set of files once again.
In the same way, that is how we’ll migrate from the old system to the new one. It is just a set of files on disk, and we can just create new hard links as needed.
Advanced scenarios behavior
I mentioned earlier that a well-known technique for database optimizations is to split the database file and the journals into separate volumes (which provides higher overall I/O throughput). If the database and the indexes reside on different volumes, we cannot use hard links, and the entire premise of this feature fails.
In practice, at least for our users’ scenarios, that tends to be the exception rather than the rule. And shared journals are a relevant optimization for the most common deployment model.
Additional optimizations - vectored I/O
The idea behind shared journals is that we can funnel the writes from multiple environments through a single pipe, presenting the disk with fewer (and larger) writes. The fact that we need to write multiple buffers at the same time also means that we can take advantage of even more optimizations.
In Windows, we can use WriteFileGather to submit a single system call to merge multiple writes from many indexes and the database. On Linux, we use pwritev for the same purpose. The end result is additional optimizations beyond just the merged writes.
I have been working on this set of features for a very long time, and all of them are designed to be completely invisible to the user. They either give us a lot more flexibility internallyor they are meant to just provide better performance without requiring any action from the user.
I’m really looking forward to showing the performance results. We’ll get to that in the next post…
Update: 2026-07-13 - I originally wrote this in early 2025 intended for RavenDB 7.1. It turns out that we got higher priorities (a whole new set of AI features) that pushed this to RavenDB 8.0.
After describing in detail the major refactoring we did for how RavenDB (via Voron, its storage engine) has gone through, there is one question remaining. What’s the point? The code is a lot simpler, of course, but the whole point of this much effort is to allow us to do interesting things.
There is performance, of course, but we haven’t gotten around to testing that yet because something that is a lot more interesting came up: Disk space management.
Voron allocates disk space from the operating system in batches of up to 1GB at a time. This is done to reduce file fragmentation and allow the file system to optimize the disk layout. It used to be something critical, but SSDs and NVMe made that a lot less important (but still a factor).
What happens if we have a very large database, but we delete a big collection of documents? This is a case where the user’s expectations and Voron’s behavior diverge. A user who just deleted a few million documents would expect to see a reduction in the size of the database. But Voron will mark the area on the disk as “to-be-used-later” and won’t free the disk space back to the operating system.
There were two reasons for this behavior:
We designed Voron in an era where it was far more common for systems to have hard disks, where fragmentation was a very serious problem.
It is really complicated to actually release disk space back to the operating system.
The first reason is no longer that relevant, since most database servers can reasonably expect to run on SSD or NVMe these days, significantly reducing the cost of fragmentation. The second reason deserves a more in-depth answer.
In order to release disk space back to the operating system, you have to do one of three things:
Store the data across multiple files and delete a file where it is no longer in use.
Run compaction, basically re-build the database from scratch in a compact form.
Use advanced features such as sparse files (hole punching) to return space to the file system without changing the file size.
The first option, using multiple files, is possible but pretty complex. Mostly because of the details of how you split to multiple files, whenever a single entry in an otherwise empty file will prevent its deletion, etc. There are also practical issues, such as the number of open file handles that are allowed, internal costs at the operating system level, etc.
Compaction, on the other hand, requires that you have enough space available during the compaction to run. In other words, if your disk is 85% full, and you delete 30% of the data, you don’t have free space to run a compaction.
Another consideration for compaction is that it can be really expensive. Running compaction on a 100GB database, for example, can easily take hours and in the cloud will very quickly exhaust your I/O credits.
RavenDB & Voron have supported compaction for over a decade, but it was always something that you did on very rare occasions. A user had to manually trigger it, and the downsides are pretty heavy, as you can see.
In most cases, I have to say, returning disk space back to the operating system is not something that is that interesting. That free space is handled by RavenDB and will be reused before we’ll allocate any additional new space from the OS. However, this is one of those features that keep coming up, because we go against users’ expectations.
The final option I discussed is using hole punching or sparse files (the two are pretty much equivalent - different terms between operating systems). The idea is that we can go to the operating system and tell it that a certain range in the file is not used, and that it can make use of that disk space again. Any future read from that range will return zeroes. If you write to this region, the file system will allocate additional space for those writes.
That behavior is problematic for RavenDB, because we used to use memory-mapped I/O to write to the disk. If there isn’t sufficient space to write, memory-mapped I/O is going to generate a segmentation fault / access violation. In general, getting an access violation because of a disk full is not okay by us, so we couldn’t use sparse files. The only option we were able to offer to reduce disk space was full compaction.
You might have noticed that I used past tense in the last paragraph. That is because I am now no longer limited to using just memory-mapped I/O. Using normal I/O for this purpose works even if we run out of disk space, we will get the usual disk full error (which we are already handling anyway).
Yes, that means that starting with RavenDB 7.1 8.0, we’ll automatically release free disk space directly back to the operating system, matching your likely expectations about the behavior. This is done in increments of 1MB, since we still want to reduce fragmentation and the number of file metadata that the file system needs to manage.
The one MB trigger
RavenDB will punch a hole in the file whenever there is a consecutive 1MB of free space. This is important to understand because of fragmentation. If you wrote 100 million documents, each 2 KB in size, and then deleted every second document, what do you think will happen? There won’t be any consecutive 1MB range for us to free.
Luckily, that sort of scenario tends to be pretty rare, and it is far more common to have clustering of writes and deletes, which allow us to take advantage of locality and free the disk space back to the OS automatically.
RavenDB will first use all the free space inside the file, reclaiming sparse regions as needed, before it will request additional disk space from the OS. When we do request additional space, we’ll still get it in large chunks (and without using sparse files). That is because it is far more likely to be immediately used, and we want to avoid giving the file system too much work.
Note that the overall file size is going to stay the same, but the actually used disk space is going to be reduced. We updated the RavenDB Studio to report both numbers, but when browsing the files manually, you need to keep that in mind.
I expect that this will be most noticeable for users who are running on cloud instances, where it is common to size the disks to be just sufficiently big enough for actual usage.
It Just Works
There is no action that you need to take to enable this behavior, and on first start of RavenDB 7.1 8.0, it will immediately release any free space already in the data files.
The work was actually completed and merged in August 2024, but it is going to be released sometime in Q2/Q3 of 2025. You might have noticed that there have been a lot of low-level changes targeted at RavenDB 7.1 8.0. We need to run them through the wringer to make sure that everything works as it should.’
Update: 2026-07-13we got held up, and this was pushed to the RavenDB 8.0 release.
I’m looking forward to seeing this in action, there are some really nice indications about the sort of results we can expect. I’ll talk about that in more detail in another post, this one is getting long enough.
Update: 2026-07-13 - I originally wrote this in early 2025 intended for RavenDB 7.1. It turns out that we got higher priorities (a whole new set of AI features) that pushed this to RavenDB 8.0.
In the previous post, I talked about a massive amount of effort (2+ months of work) and about 25,000 lines of code changes. The only purpose of this task was to remove two locks from the system. During high load, we spent huge amounts of time contending for these locks, so removing them was well worth the effort.
During this work, I essentially found myself in the guts of Voron (RavenDB’s storage engine) and mostly dealing with old code. I’m talking about code that was written between 10 and 15 years ago. I wrote a blog post about it at the time. Working with old code is an interesting experience, especially since most of this code was written by me. I can remember some of my thoughts from the time I wrote it.
Old code is working code, and old code is also something that was built upon. Other parts of the codebase are making assumptions about the way the system behaves. And the more time a piece of code doesn't change, the more likely its behavior is going to ossify. Changing old code is hard because of the many ways that such dependencies can express themselves.
I dug through all of this decade-plus old code and I realized something pretty horrible.
It turns out that I made a mistake in understanding how Windows implements buffering for memory-mapped files. I realized my mistake around mid-2024, see the related post for the
actual details.
The TLDR summary, however, is that when using unbuffered file I/O with memory-mapped files on Windows, you cannot expect the mapped memory to reflect the data written using the file I/O API. Windows calls it coherence, and it was quite confusing when I first realized what the problem was. It turns out that this applies only to unbuffered I/O and there is no such problem with buffered I/O.
The scenario I needed to work with can use buffered I/O, however, which has been a profound shock to me. Large portions of the architecture of Voron are actually shaped by this limitation.
Because I thought that you couldn’t use both file I/O and memory-mapped files at the same time in Windows and get a consistent view of the data (the documentation literally says that, I have to add), RavenDB used memory-mapped I/O to write to the data file. That is a choice, certainly, but not one that I particularly liked. It was just that I was able to make things work and move on to other things.
This is another tale of accidental complexity, actually. I had a problem and found a solution to it, which at the time I considered quite clever. Because I had a solution, I never tried to dig any deeper into it and figure out whether this is the only solution.
This choice of using only memory-mapped I/O to write to the data file had consequences. In particular, it meant that:
We had to map the data using read-write mode.
There was no simple way to get an error if a write failed - since we just copied the data to memory, there was no actual write to fail. An error to write to disk would show up as a memory access violation (segmentation fault!) or just not show up at all.
Writing to a page that isn’t in memory may require us to read it first (even if we are overwriting all of it).
I accepted those limitations because I thought that this was the only way to do things. When I realized that I was wrong, that opened up so many possibilities. As far as the refactoring work, the way Voron did things changed significantly. We are now mapping the data file as read-only and writing to it using file I/O.
That means we have a known point of failure if we fail to write. That probably deserves some explanation. Failure to write to the disk can come in a bunch of ways. In particular, successfully writing to a file is not enough to safely store data, you also need to sync the file before you can be assured that the data is safe. The key here is that write + sync ensures that you’ll know that this either succeeded or failed.
Here is the old way we were writing to the data file. Conceptually, this looks like this:
auto mem = EnsureFileSize(pagesToWrite[pagesToWriteLength - 1].EndPosition);
for(auto i =0; i < pagesToWriteLength; i++){
auto path = pagesToWrite[i];
memcpy(mem + page.Number * 8192, page.Buffer, page.Length);}
// some later time
if(FAILED(msync(mem))return SYNC_FAILURE;
And here is the first iteration of using the file I/O API for writes.
fallocate_if_needed(pagesToWrite[pagesToWriteLength - 1].EndPosition);
for(auto i =0; i < pagesToWriteLength; i++){
auto path = pagesToWrite[i];
if(FAILED(pwrite(page.Number * 8192, page.Buffer, page.Length)))return WRITE_FAILURE;}
// some time later
if(FAILED(fdatasync(file))return SYNC_FAILURE;
Conceptually, this is just the same, but notice that we respond immediately to write failures here.
When we started testing this feature, we realized something really interesting. The new version was much slower than the previous one, and it also generated a lot more disk writes.
I moved mountains for this?
Sometimes you get a deep sense of frustration when you look at benchmark results. The amount of work invested in this change is… pretty high. And from an architectural point of view, I’m loving it. The code is simpler, more robust, and allows us to cleanly do a lot more than we used to be able to.
The code also should be much faster, but it wasn’t. And given that performance is a critical aspect of RavenDB, that may cause us to scrap the whole thing.
Looking more deeply into the issue, it turned out that my statement about old code and the state of the system was spot on. Take a look at the two code snippets above and consider how they look from the point of view of the operating system. In the case of the memcpy() version, there is a strong likelihood that the kernel isn’t even involved (the pages are already paged in), and the only work done here is marking them as dirty (done by the CPU directly).
That means that the OS will figure out that it has stuff to write to the disk either when we call msync() or when its own timer is called. On the other hand, when we call pwrite(), we involve the OS at every stage of the process, making it far more likely that it will start the actual write to the disk earlier. That means that we are wasting batching opportunities.
In other words, because we used memory-mapped writes, we (accidentally, I might add) created a situation where we tried very hard to batch those writes in memory as much as possible. Another aspect here is that we are issuing a separate system call for each page. That means we are paying another high price.
The good thing about this is that we now have a good way to deal with those issues. The pwrite() code above was simply the first version used to test things out. Since we now have the freedom to run, we can use whatever file I/O we want.
In particular, RavenDB 7.1 8.0 now supports the notion of write modes, with the following possible options:
mmap - exactly like previous versions, uses a writable memory map and memcpy() to write the values to the data file.
file_io - uses pwrite() to write the data, onc page at a time, as shown above.
vectored_file_io - uses pwritev() to write the data, merging adjacent writes to reduce the number of system calls we use (Posix only, since Windows has strict limits on this capability).
io_ring - uses HIORING (Windows) / IO_Uring (Linux) to submit the whole set of work to the kernel as a single batch of operations.
RavenDB will select the appropriate mode for the system on its own, usually selecting io_ring for modern Linux and Windows machines, and vectored_file_io for Mac. You can control that using the RAVEN_VORON_WRITER_MODE environment variable, but that is provided only because we want to have an escape hatch, not something that you are meant to configure.
With those changes, we are on a much better footing for overall performance, but we aren’t done yet! I would love to give you the performance numbers, but we didn’t actually run the full test suite with just these changes. And that is because we aren’t done yet, I’ll cover that in the next post.
Update: 2026-07-13 - I originally wrote this in early 2025 intended for RavenDB 7.1. It turns out that we got higher priorities (a whole new set of AI features) that pushed this to RavenDB 8.0.
Even though RavenDB 7.0 isn’t quite out of the gate yet (expect the release very soon), I want to start talking about the RavenDB 7.1 8.0 release. This release is going to represent the biggest change in RavenDB in about 7 years, and at the same time, it is expected to be a complete non-event for most people.
We care enough about performance that we have both a dedicated team to verify it as well as really talented people whose sole job is to run benchmarks and optimize RavenDB. This year, the goal was to test RavenDB’s performance when running on large machines (many hundreds of GBs or RAM, dozens of cores, etc). The idea was to find bottlenecks and remove them, and we quickly found a few.
Performance optimization is often a very repetitive process. Find a problem, figure out the root cause, and move on. It is a process full of small changes and 0.1% improvements. The key is that if you practice this routinely, you end up with real measurable results over time, since your changes compound.
Most of the time, these are the changes you celebrate:
Here you can see a 6.6% increase in the number of operations per millisecond. That is a pretty big change, especially since it affects reading documents from storage.
We were roughly two months into this process when we ran into the end of the line. The scenario in question was 95% reads / 5% writes, with the idea of seeing how quickly the system responds under load, but without stressing it to the limits. Take a look at our findings:
What you can see here is that creating a transaction is costly, andover 50% of that cost is due to contention over a lock. We didn’t notice that until we had a lot of cores to go around, since there wasn’t a sufficient number of threads actively contending for this lock. Once we started looking for it, the problem was very apparent and visible on smaller machines as well.
RavenDB creates a single transaction per request, so that means we are spending a lot of time doing essentially nothing useful. What is worse, this is actively spinning. So the more cores we have, the more CPU we’ll use and the less useful work we’ll do. Yuck!
When we looked at the root cause, the problem became pretty apparent. Take a look at the following snippet:
_txCreation.EnterReadLock();// creating read transaction
try
{
_cancellationTokenSource.Token.ThrowIfCancellationRequested();
tx =newLowLevelTransaction(previous.LowLevelTransaction, transactionPersistentContext, context);
ActiveTransactions.Add(tx);}
finally
{
_txCreation.ExitReadLock();}
using (PreventNewTransactions())// during commit of write transaction{if(tx.Committed && tx.FlushedToJournal)
Interlocked.Exchange(ref _transactionsCounter, tx.Id);
State = tx.State;
Journal.Applicator.OnTransactionCommitted(tx);
ScratchBufferPool.UpdateCacheForPagerStatesOfAllScratches();
Journal.UpdateCacheForJournalSnapshots();
tx.OnAfterCommitWhenNewTransactionsPrevented();}
What happens is that during the commit of a write transaction we need to make updates to a bunch of places. We also need all new read transactions to see all our changes at once. So during commit, we take a short lock to update a couple of locations. And when we create a write transaction, we hold a read lock to be able to properly read all those values safely.
This particular code (and the approach in general) dates back to the very early days of Voron:
On one hand, I look at this code and cringe internally. On the other hand, it has served us really well for a long time. Of course, on the gripping hand, that code has been around for long enough to have grown some barnacles.
Notice the OnAfterCommitWhenNewTransactionsPrevented() call we have there? It is meant to allow other operations that need to run while no read transactions are allowed, in order to maintain in-memory consistency.
Fixing this issue was both straightforward and quite complex at the same time. Instead of storing all the data in various places, I introduced the following record:
record EnvironmentStateRecord(
    Pager.State DataPagerState,
    long TransactionId,
    ImmutableDictionary<long, PageFromScratchBuffer> ScratchPagesTable,
    TreeRootHeader Root,
    long NextPageNumber,
    (long Number, long Last4KWritePosition) Journal,
    object ClientState);
The actual details of what it does aren’t really that interesting. What is important is that we have an immutable record that is being generated by the write transaction. That record contains all the database state that we carry over between transactions. When we want to publish this state, we can just make a single atomic write to a pointer, no need for a lock.
Of course, it can’t be that simple. We needed to essentially convert large portions of the code to take their state from the environment record and provide a way for higher-level code to add their own state to the record on write.
That took about two months of hard work, I think. Not complicated work, just grinding through all of those places, figuring out the best way to represent that, and making all the necessary changes.
Unfortunately, that wasn’t the only lock convoy we found. Files inside RavenDB are held by a class called Pager (since it serves pages of data). A file (Pager) may hold multiple States, which is a fancy way of referring to a memory-mapped range we use. The Pager may hold multiple such mapping concurrently. For example, if we increase the file size, we need to map the memory again - so for a certain period of time, we have two such mappings.
A transaction may create a reference to such a state (and thus may access the mapping) for its lifetime. At the end of the transaction, we can release the state, and if it is the last reference, we’ll close the mapping.
This is implemented using the following code:
This runs for multiple Pagers for each transaction, mind you. The actual AddRef() call is very cheap, but the lock…
As you can see from the image, this is also pretty old code. The problem was how to deal with the issue. I have to be able to keep track of the mapped memory if a transaction is using it, but at the same time, I want to dispose of it quickly if it isn’t being used.
The answer to this question was to lean on the GC. Instead of implementing AddRef() / Release(), I hold the Pager.State object and handle disposal in the finalizer. If there is a reference to it, the finalizer isn’t called, so this gives me the exact behavior I want, for free.
However… I also need to be able to dispose of this explicitly when closing the pager. A common scenario is that I’m closing the Pager and deleting the directory. If I have an outstanding reference to the file, that will fail.
Here is how I’m dealing with the issue. The Pager holds a Weak-Reference to the State and may explicitly dispose of it:
publicvoidDispose(){
foreach (WeakReference<State> state in _states){if(state.TryGetTarget(out var v)){v.Dispose();}}}
That also allowed me to refactor the way we deal with files in general inside Voron. The first version of Voron did everything in managed code (including significant P/Invoke and cross-platform work). At some point, we introduced a native DLL (PAL - Platform Abstraction Layer - written in C) that allowed us to have a more consistent API.
The issue was that there was no clean division of labor between the native C code and the managed code, and some responsibilities were split between them in a way that wasn’t very clean.
RavenDB is using Zig
To be rather more exact, I’m using Zig as a build system to make cross-compilation a lot easier. I initially moved everything to use Zig, but it turns out that Zig isn’t able to produce DLLs that would run properly on older versions of Windows.
As a final thought, this work took several months, and when I got to the end, we got a pull request with some interesting numbers (+11.3K LOC, -11.2K LOC).
I have to admit that I feel a bit bad about that for the reviewers 🙂. I was really hoping that I would get a net negative result in the number of lines changed, but that couldn’t be helped. The end result is that all of our state is now far simpler, but we didn’t actually change anything in the way we behave. We removed two frequently hit lock convoys and allowed RavenDB to be far more efficient.
How efficient? Well… that is a bit complex to answer, because we didn’t stop here. There are more things that happened in RavenDB 7.1 8.0 that I need to talk to you about. We’ll cover them in my next post.
In my previous post, I discussed how Linux will silently truncate a big write (> 2 GB) for you. That is expected by the interface of write(). The problem is that this behavior also applies when you use IO_Uring.
If BUFFER_SIZE is 3 GB, then this will write about 2 GB to the file. The number of bytes written is correctly reported, but the complexity this generates is huge. Consider the following function:
In other words, send all the data to the IO Ring, then wait for all those operations to complete. We verify complete success and can then move on. However, because we may have a write that is greater than 2 GB, and because the interface allows the IO Uring to write less than we thought it would, we need to handle that with retries.
After thinking about this for a while, I came up with the following implementation:
int32_t _submit_writes_to_ring(
struct handle *handle,
int32_t count,
struct page_to_write *buffers,
int32_t* detailed_error_code){
struct io_uring *ring =&handle->global_state->ring;
off_t *offsets = handle->global_state->offsets;
memset(offsets, 0, count * sizeof(off_t));
while(true){
int32_t submitted =0;for(size_t i =0; i < count; i++){
off_t offset = offsets[i];
if(offset == buffers[i].count_of_pages * VORON_PAGE_SIZE)continue;
struct io_uring_sqe *sqe = io_uring_get_sqe(ring);if(sqe == NULL) // the ring is full, flush it...
break;
io_uring_sqe_set_data(sqe, i);
io_uring_prep_write(sqe, handle->file_fd,
buffers[i].ptr + offset,
buffers[i].count_of_pages * VORON_PAGE_SIZE - offset,
buffers[i].page_num * VORON_PAGE_SIZE + offset);
submitted++;}
if(submitted ==0)return SUCCESS;
int32_t rc = io_uring_submit_and_wait(ring, submitted);
if(rc <0){
*detailed_error_code = -rc;return FAIL_IO_RING_SUBMIT;}
struct io_uring_cqe *cqe;
uint32_t head=0;
uint32_t i =0;
bool has_errors =false;
io_uring_for_each_cqe(ring, head, cqe){
i++;
uint64_t index = io_uring_cqe_get_data64(cqe);
int result = cqe->res;
if(result <0){
has_errors =true;
*detailed_error_code = -result;}else{
offsets[index]+= result;
if(result ==0){
// there shouldn't be a scenario where we return0
// for a write operation, we may want to retry here
// but figuring out if this is a single happening, of if
// we need to retry this operation (_have_ retried it?) is
// complex enough to treat this as an error for now.
has_errors =true;
*detailed_error_code = EIO;}}}
io_uring_cq_advance(ring, i);
if(has_errors)return FAIL_IO_RING_WRITE_RESULT;}}
That is a lot of code, but it is mostly because of how C works. What we do here is scan through the buffers we need to write, as well as scan through an array of offsets that store additional information for the operation.
If the offset to write doesn’t indicate that we’ve written the whole thing, we’ll submit it to the ring and keep going until we either fill the entire ring or run out of buffers to work with. The next step is to submit the work and wait for it to complete, then run through the results, check for errors, and update the offset that we wrote for the relevant buffer.
Then, we scan the buffers array again to find either partial writes that we have to complete (we didn’t write the whole buffer) or buffers that we didn’t write at all because we filled the ring. In either case, we submit the new batch of work to the ring and repeat until we run out of work.
This code assumes that we cannot have a non-error state where we write 0 bytes to the file and treats that as an error. We also assume that an error in writing to the disk is fatal, and the higher-level code will discard the entire IO_Uring if that happens.
The Windows version, by the way, is somewhat simpler. Windows explicitly limits the size of the buffer you can pass to the write() call (and its IO Ring equivalent). It also ensures that it will write the whole thing, so partial writes are not an issue there.
It is interesting to note that the code above will effectively stripe writes if you send very large buffers. Let’s assume that we send it two 4 GB buffers, like so:
Offset
Size
Buffer 1
1 GB
4 GB
Buffer 2
10 GB
6 GB
The patterns of writes that will actually be executed are:
1GB .. 3 GB, 10 GB .. 12 GB
3 GB .. 5 GB, 12 GB .. 14 GB
14 GB .. 16 GB
I can “fix” that by never issuing writes that are larger than 2 GB and issuing separate writes for each 2 GB range, but that leads to other complexities (e.g., tracking state if I split a write and hit the full ring status, etc.). At those sizes, it doesn’t actually matter in terms of efficiency or performance.
Partial writes are almost always a sign of either very large writes that were broken up or some underlying issue that is already problematic, so I don’t care that much about that scenario in general. For the vast majority of cases, this will always issue exactly one write for each buffer.
What is really interesting from my point of view, however, is how even a pretty self-contained feature can get pretty complex internally. On the other hand, this behavior allows me to push a whole bunch of work directly to the OS and have it send all of that to the disk as fast as possible.
In our scenarios, under load, we may call that with thousands to tens of thousands of pages (each 8 KB in size) spread all over the file. The buffers are actually sorted, so ideally, the kernel will be able to take advantage of that, but even if not, just reducing the number of syscalls will result in performance savings.
RavenDB is a transactional database, we care deeply about ACID. The D in ACID stands for durability, which means that to acknowledge a transaction, we must write it to a persistent medium. Writing to disk is expensive, writing to the disk and ensuring durability is even more expensive.
After seeing some weird performance numbers on a test machine, I decided to run an experiment to understand exactly how durable writes affect disk performance.
A few words about the term durable writes. Disks are slow, so we use buffering & caches to avoid going to the disk. But a write to a buffer isn’t durable. A failure could cause it to never hit a persistent medium. So we need to tell the disk in some way that we are willing to wait until it can ensure that this write is actually durable.
This is typically done using either fsync or O_DIRECT | O_DSYNC flags. So this is what we are testing in this post.
I wanted to test things out without any of my own code, so I ran the following benchmark.
I pre-allocated a file and then ran the following commands.
Normal writes (buffered) with different sizes (256 KB, 512 KB, etc).
I got myself an i4i.xlarge instance on AWS and started running some tests. That machine has a local NVMe drive of about 858 GB, 32 GB of RAM, and 4 cores. Let’s see what kind of performance I can get out of it.
Write sizeTotal writesBuffered writes
256 KB
256 MB
1.3 GB/s
512 KB
512 MB
1.2 GB/s
1 MB
1 GB
1.2 GB/s
2 MB
2 GB
731 Mb/s
8 MB
8 GB
571 MB/s
16 MB
16 GB
561 MB/s
2 MB
8 GB
559 MB/s
1 MB
1 GB
554 MB/s
4 KB
16 GB
557 MB/s
16 KB
16 GB
553 MB/s
What you can see here is that writes are really fast when buffered. But when I hit a certain size (above 1 GB or so), we probably start having to write to the disk itself (which is NVMe, remember). Our top speed is about 550 MB/s at this point, regardless of the size of the buffers I’m passing to the write() syscall.
I’m writing here using cached I/O, which is something that as a database vendor, I don’t really care about. What happens when we run with direct & sync I/O, the way I would with a real database? Here are the numbers for the i4i.xlarge instance for durable writes.
Write sizeTotal writesDurable writes
256 KB
256 MB
1.3 GB/s
256 KB
1 GB
1.1 GB/s
16 MB
16 GB
584 GB/s
64 KB
16 GB
394 MB/s
32 KB
16 GB
237 MB/s
16 KB
16 GB
126 MB/s
In other words, when using direct I/O, the smaller the write, the more time it takes. Remember that we are talking about forcing the disk to write the data, and we need to wait for it to complete before moving to the next one.
For 16 KB writes, buffered writes achieve a throughput of 553 MB/s vs. 126 MB/s for durable writes. This makes sense, since those writes are cached, so the OS is probably sending big batches to the disk. The numbers we have here clearly show that bigger batches are better.
My next test was to see what would happen when I try to write things in parallel. In this test, we run 4 processes that write to the disk using direct I/O and measure their output.
I assume that I’m maxing out the throughput on the drive, so the total rate across all commands should be equivalent to the rate I would get from a single command.
To run this in parallel I’m using a really simple mechanism - just spawn processes that would do the same work. Here is the command template I’m using:
This would write to 4 different portions of the same file, but I also tested that on separate files. The idea is to generate a sufficient volume of writes to stress the disk drive.
Write sizeTotal writesDurable & Parallel writes
16 MB
8 GB
650 MB/s
16 KB
64 GB
252 MB/s
I also decided to write some low-level C code to test out how this works with threads and a single program. You can find the code here. I basically spawn NUM_THREADS threads, and each will open a file using O_SYNC | O_DIRECT and write to the file WRITE_COUNT times with a buffer of size BUFFER_SIZE.
This code just opens a lot of files and tries to write to them using direct I/O with 8 KB buffers. In total, I’m writing 16 GB (128 MB x 128 threads) to the disk. I’m getting a rate of about 320 MB/sec when using this approach.
As before, increasing the buffer size seems to help here. I also tested a version where we write using buffered I/O and call fsync every now and then, but I got similar results.
The interim conclusion that I can draw from this experiment is that NVMes are pretty cool, but once you hit their limits you can really feel it. There is another aspect to consider though, I’m running this on a disk that is literally called ephemeral storage. I need to repeat those tests on real hardware to verify whether the cloud disk simply ignores the command to persist properly and always uses the cache.
That is supported by the fact that using both direct I/O on small data sizes didn’t have a big impact (and I expected it should). Given that the point of direct I/O in this case is to force the disk to properly persist (so it would be durable in the case of a crash), while at the same time an ephemeral disk is wiped if the host machine is restarted, that gives me good reason to believe that these numbers are because the hardware “lies” to me.
In fact, if I were in charge of those disks, lying about the durability of writes would be the first thing I would do. Those disks are local to the host machine, so we have two failure modes that we need to consider:
The VM crashed - in which case the disk is perfectly fine and “durable”.
The host crashed - in which case the disk is considered lost entirely.
Therefore, there is no point in trying to achieve durability, so we can’t trust those numbers.
The next step is to run it on a real machine. The economics of benchmarks on cloud instances are weird. For a one-off scenario, the cloud is a godsend. But if you want to run benchmarks on a regular basis, it is far more economical to just buy a physical machine. Within a month or two, you’ll already see a return on the money spent.
We got a machine in the office called Kaiju (a Japanese term for enormous monsters, think: Godzilla) that has:
32 cores
188 GB RAM
2 TB NVMe for the system disk
4 TB NVMe for the data disk
I ran the same commands on that machine as well and got really interesting results.
Write sizeTotal writesBuffered writes
4 KB
16 GB
1.4 GB/s
256 KB
256 MB
1.4 GB/s
2 MB
2 GB
1.6 GB/s
2 MB
16 GB
1.7 GB/s
4 MB
32 GB
1.8 GB/s
4 MB
64 GB
1.8 GB/s
We are faster than the cloud instance, and we don’t have a drop-off point when we hit a certain size. We are also seeing higher performance when we throw bigger buffers at the system.
But when we test with small buffers, the performance is also great. That is amazing, but what about durable writes with direct I/O?
I tested the same scenario with both buffered and durable writes:
ModeBufferedDurable
1 MB buffers, 8 GB write
1.6 GB/s
1.0 GB/s
2 MB buffers, 16 GB write
1.7 GB/s
1.7 GB/s
Wow, that is an interesting result. Because it means that when we use direct I/O with 1 MB buffers, we lose about 600 MB/sec compared to buffered I/O. Note that this is actually a pretty good result. 1 GB/sec is amazing.
And if you use big buffers, then the cost of direct I/O is basically gone. What about when we go the other way around and use smaller buffers?
ModeBufferedDurable
128 KB buffers, 8 GB write
1.7 GB/s
169 MB/s
32 KB buffers, 2 GB
1.6 GB/s
49.9 MB/s
Parallel: 8, 1 MB, 8 GB
5.8 GB/s
3.6 GB/s
Parallel: 8, 128 KB, 8 GB
6.0 GB/s
550 MB/s
For buffered I/O - I’m getting simply dreamy numbers, pretty much regardless of what I do 🙂.
For durable writes, the situation is clear. The bigger the buffer we write, the better we perform, and we pay for small buffers. Look at the numbers for 128 KB in the durable column for both single-threaded and parallel scenarios.
169 MB/s in the single-threaded result, but with 8 parallel processes, we didn’t reach 1.3 GB/s (which is 169x8). Instead, we achieved less than half of our expected performance.
It looks like there is a fixed cost for making a direct I/O write to the disk, regardless of the amount of data that we write. When using 32 KB writes, we are not even breaking into the 200 MB/sec. And with 8 KB writes, we are barely breaking into the 50 MB/sec range.
Those are some really interesting results because they show a very strong preference for bigger writes over smaller writes.
I also tried using the same C code as before. As a reminder, we use direct I/O to write to 128 files in batches of 8 KB, writing a total of 128 MB per file. All of that is done concurrently to really stress the system.
When running iotop in this environment, we get:
Total DISK READ:0.00 B/s | Total DISK WRITE: 522.56 M/s
Current DISK READ:0.00 B/s | Current DISK WRITE: 567.13 M/s
TID PRIO USER DISK READ DISK WRITE> COMMAND
142851 be/4 kaiju-1 0.00 B/s 4.09 M/s ./a.out
142901 be/4 kaiju-1 0.00 B/s 4.09 M/s ./a.out
142902 be/4 kaiju-1 0.00 B/s 4.09 M/s ./a.out
142903 be/4 kaiju-1 0.00 B/s 4.09 M/s ./a.out
142904 be/4 kaiju-1 0.00 B/s 4.09 M/s ./a.out
... redacted ...
So each thread is getting about 4.09 MB/sec for writes, but we total 522 MB/sec across all writes. I wondered what would happen if I limited it to fewer threads, so I tried with 16 concurrent threads, resulting in:
Total DISK READ:0.00 B/s | Total DISK WRITE: 89.80 M/s
Current DISK READ:0.00 B/s | Current DISK WRITE: 110.91 M/s
TID PRIO USER DISK READ DISK WRITE> COMMAND
142996 be/4 kaiju-1 0.00 B/s 5.65 M/s ./a.out
143004 be/4 kaiju-1 0.00 B/s 5.62 M/s ./a.out
142989 be/4 kaiju-1 0.00 B/s 5.62 M/s ./a.out
... redacted ..
Here we can see that each thread is getting (slightly) more throughput, but the overall system throughput is greatly reduced.
To give some context, with 128 threads running, the process wrote 16GB in 31 seconds, but with 16 threads, it took 181 seconds to write the same amount. In other words, there is a throughput issue here. I also tested this with various levels of concurrency:
Concurrency(8 KB x 16K times - 128 MB)Throughput per threadTime / MB written
1
15.5 MB / sec
8.23 seconds / 128 MB
2
5.95 MB / sec
18.14 seconds / 256 MB
4
5.95 MB / sec
20.75 seconds / 512 MB
8
6.55 MB / sec
20.59 seconds / 1024 MB
16
5.70 MB / sec
22.67 seconds / 2048 MB
To give some context, here are two attempts to write 2GB to the disk:
ConcurrencyWriteThroughputTotal writtenTotal time
16
128 MB in 8 KB writes
5.7 MB / sec
2,048 MB
22.67 sec
8
256 MB in 16 KB writes
12.6 MB / sec
2,048 MB
22.53 sec
16
256 MB in 16 KB writes
10.6 MB / sec
4,096 MB
23.92 sec
In other words, we can see the impact of concurrent writes. There is absolutely some contention at the disk level when making direct I/O writes. The impact is related to the number of writes rather than the amount of data being written.
Bigger writes are far more efficient. And concurrent writes allow you to get more data overall but come with a horrendous latency impact for each individual thread.
The difference between the cloud and physical instances is really interesting, and I have to assume that this is because the cloud instance isn’t actually forcing the data to the physical disk (it doesn’t make sense that it would).
I decided to test that on an m6i.2xlarge instance with a 512 GB io2 disk with 16,000 IOPS.
The idea is that an io2 disk has to be durable, so it will probably have similar behavior to physical hardware.
DiskBuffer SizeWritesDurableParallelTotalRate
io2
256.00
1,024.00
No
1.00
256.00
1,638.40
io2
2,048.00
1,024.00
No
1.00
2,048.00
1,331.20
io2
4.00
4,194,304.00
No
1.00
16,384.00
1,228.80
io2
256.00
1,024.00
Yes
1.00
256.00
144.00
io2
256.00
4,096.00
Yes
1.00
1,024.00
146.00
io2
64.00
8,192.00
Yes
1.00
512.00
50.20
io2
32.00
8,192.00
Yes
1.00
256.00
26.90
io2
8.00
8,192.00
Yes
1.00
64.00
7.10
io2
1,024.00
8,192.00
Yes
1.00
8,192.00
502.00
io2
1,024.00
2,048.00
No
8.00
2,048.00
1,909.00
io2
1,024.00
2,048.00
Yes
8.00
2,048.00
1,832.00
io2
32.00
8,192.00
No
8.00
256.00
3,526.00
io2
32.00
8,192.00
Yes
8.00
256.00
150.9
io2
8.00
8,192.00
Yes
8.00
64.00
37.10
In other words, we are seeing pretty much the same behavior as on the physical machine, unlike the ephemeral drive.
In conclusion, it looks like the limiting factor for direct I/O writes is the number of writes, not their size. There appears to be some benefit for concurrency in this case, but there is also some contention. The best option we got was with big writes.
Interestingly, big writes are a win, period. For example, 16 MB writes, direct I/O:
Single-threaded - 4.4 GB/sec
2 threads - 2.5 GB/sec X 2 - total 5.0 GB/sec
4 threads - 1.4 X 4 - total 5.6 GB/sec
8 threads - ~590 MB/sec x 8 - total 4.6 GB/sec
Writing 16 KB, on the other hand:
8 threads - 11.8 MB/sec x 8 - total 93 MB/sec
4 threads - 12.6 MB/sec x 4- total 50.4 MB/sec
2 threads - 12.3 MB/sec x 2 - total 24.6 MB/sec
1 thread - 23.4 MB/sec
This leads me to believe that there is a bottleneck somewhere in the stack, where we need to handle the durable write, but it isn’t related to the actual amount we write. In short, fewer and bigger writes are more effective, even with concurrency.
As a database developer, that leads to some interesting questions about design. It means that I want to find some way to batch more writes to the disk, especially for durable writes, because it matters so much.
When building RavenDB, we occasionally have to deal with some ridiculous numbers in both size and scale. In one of our tests, we ran into an interesting problem. Here are the performance numbers of running a particular query 3 times.
First Run: 19,924 ms
Second Run: 3,181 ms
Third Run: 1,179 ms
Those are not good numbers, so we dug into this to try to figure out what is going on. Here is the query that we are running:
from index 'IntFloatNumbers-Lucene' where Int >0
And the key here is that this index covers 400 million documents, all of which are actually greater than 0. So this is actually a pretty complex task for the database to handle, mostly because of the internals of how Lucene works.
Remember that we provide both the first page of the results as well as its total number. So we have to go through the entire result set to find out how many items we have. That is a lot of work.
But it turns out that most of the time here isn’t actually processing the query, but dealing with the GC. Here are some entries from the GC log while the queries were running:
This isn’t exactly how it works, mind. But the details don’t really matter for this story. The key here is that we have an array with a sorted list of terms, and in this case, we have a lot of terms.
Those values are cached, so they aren’t actually allocated and thrown away each time we query. However, remember that the .NET GC uses a Mark & Sweep algorithm. Here is the core part of the Mark portion of the algorithm:
long _marker;
void Mark(){
var currentMarker = ++_marker;
foreach (var root in GetRoots()){
Mark(root);}
void Mark(object o){
// already visited
if(GetMarket(o)== currentMarker)return;
foreach (var child in GetReferences(node)){
Mark(child);}}}
Basically, start from the roots (static variables, items on the stack, etc.), scan the reachable object graph, and mark all the objects in use. The code above is generic, of course (and basically pseudo-code), but let’s consider what the performance will be like when dealing with an array of 190M strings.
It has to scan the entire thing, which means it is proportional to the number of objects. And we do have quite a lot of those.
The problem was the number of managed objects, so we pulled all of those out. We moved the term storage to unmanaged memory, outside the purview of the GC. As a result, we now have the following Memory Usage & Object Count:
Number of objects for GC (under LuceneIndexPersistence): 168K (~6.64GB)
So the GC time is now in the range of 100ms, instead of several seconds. This change helps both reduce overall GC pause times and greatly reduce the amount of CPU spent on managing garbage.
Those are still big queries, but now we can focus on executing the query, rather than managing maintenance tasks. Incidentally, those sorts of issues are one of the key reasons why we built Corax, which can process queries directly on top of persistent structures, without needing to materialize anything from the disk.
I write a transactional database for a living, and the best example of why we want transactions is transferring money between accounts. It is ironic, therefore, that there is no such thing as transactions for money transfers in the real world.
If you care to know why, go back 200 years and consider how a bank would operate in an environment without instant communication. I would actually recommend doing that, it is a great case study in distributed system design. For example, did you know that the Templars used cryptography to send money almost a thousand years ago?
Recently I was reviewing my bank transactions and I found the following surprise. This screenshot is from yesterday (Dec 18), and it looks like a payment that I made is still “stuck in the tubes” two and a half weeks later.
I got in touch with the supplier in question to apologize for the delay. They didn’t understand what I was talking about. Here is what they see when they go to their bank, they got the money.
For fun, look at the number of different dates that you can see in their details.
Also, as of right now, my bank account still shows the money as pending approval (to be sent out from my bank).
I might want to recommend that they use a different database. Or maybe I should just convince the bank to approve the payment by the time of the next invoice and see if I can get a bit of that infinite money glitch.


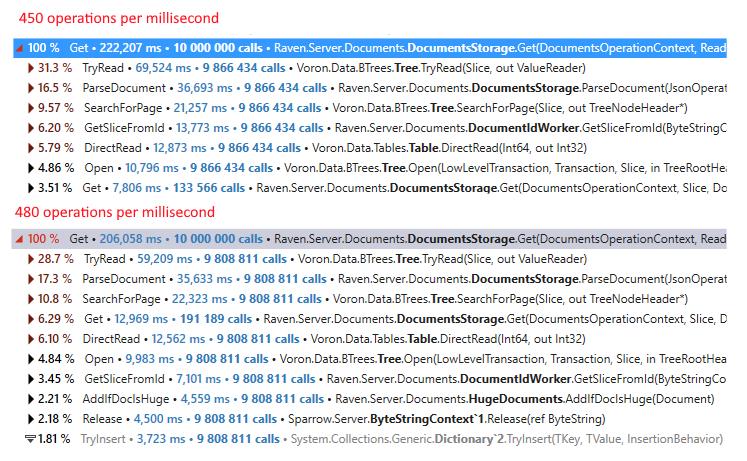
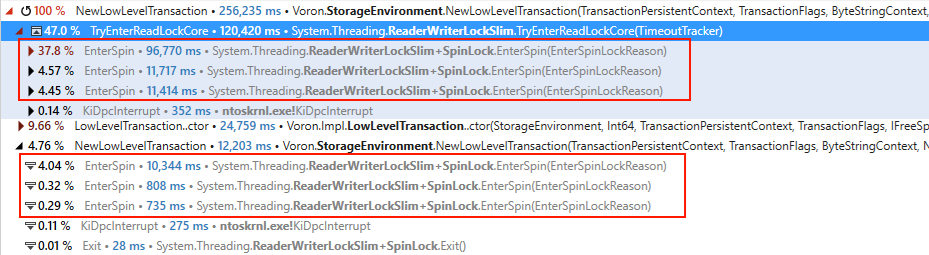
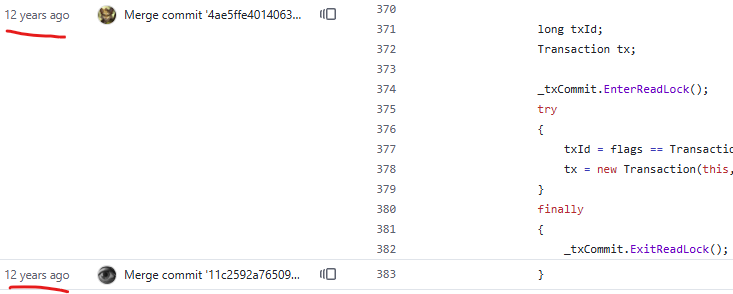
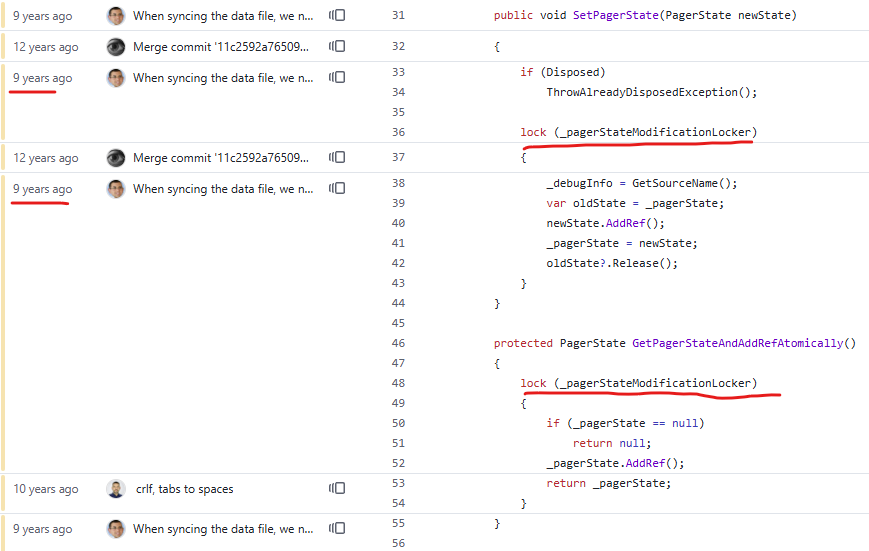
 As a final thought, this work took several months, and when I got to the end, we got a pull request with some interesting numbers (+11.3K LOC, -11.2K LOC).