Oren Eini

CEO of RavenDB

a NoSQL Open Source Document Database

Get in touch with me:

oren@ravendb.net +972 52-548-6969

Posts: 7,546
|
Comments: 51,161
Privacy Policy · Terms
filter by tags archive
time to read 5 min | 810 words

When laying out the design work for RavenDB 4.0, it became clear that we needed more from our storage layer. That require us to modify the way we store the information on disk. Voron is inspired by the LMDB project, and that project basically has a single data type, the B+Tree.

Now, LMDB does some really crazy stuff with this, a single LMDB file can contain any number of B+Trees, and you can also have trees whose values are also trees, but that is basically the sole thing that you can use.

This is roughly what this looks like:

image

Note that there are several types of values here. Small items can be stored directly inside the B+Tree, while bigger values require separate storage, and we only store the reference to the data in the tree.

As it turns out, this is actually quite important aspect of the way you can optimize behavior inside B+Trees. If you wondered about the difference between clustered and non clustered indexes, that is exactly it. In a clustered index, the data is directly in the B+Tree. In a non clustered index, you don’t have the data directly, but need to follow the reference.

Using C#, here are the differences:

var entry = clusteredIndex.Find(key);
return entry.Data;

var nonClusteredEntry = nonClusteredIndex.Find(key);
var entry = clusteredIndex.Find(nonClusteredIndex.Data);
return entry.Data;

I’m skipping on quite a lot here, but that should give you the gist of it.

Now, where is the problem? The problem is that there if all you have is trees, this is pretty much all that you can do here. Now, let us consider the case of storing documents inside Voron. What kind of questions do we need to answer?

  • Load documents by id
  • Scan documents by id prefix
  • Scan documents by etag

As it stands, doing this using just trees would require us to:

  • Define a tree to hold the data, where the key is the document id. This allows us to both find a document by id and by key prefix.
  • Define an index for the etag, where the key is the etag, and the value is the document id.

So, let us assume that we have a piece of code that need to read documents by etag (for indexing, replication, export, etc):

var enumerator = etagsIndex.ScanFrom(etag); // O(logN)
foreach(var entry in enumerator) // O(~1) for each MoveNext(); 
{
	var actualDocument = documentsIndex.Find(entry);// O(logN);
	// do something with this
}

So, if I want to read 32,000 documents based on their etags in a database that has a hundred million documents, that is going to perform close to 900,000 comparison operations. (log2(100 M) = 27, and we issue 32K O(logN) queries on the documentsIndex).

That can get expensive. And this is a relatively simple example. In some cases, a data item might have five covering indexes, and the access rate and size get very high.

In order to resolve that, we are going to change how we layout the data on the disk. Instead of storing the data directly in the tree, we are going to move the data into separate storage. We call this raw data sections.

A raw data section can be small (for values that are less than 2KB in size) or large. Small values are grouped together in sections that are 2 – 8 MB in length. While each larger sized value is going to be place independently, rounded up to the next page size (4KB, by default). The trees will not store that data, but references to the data on disk (effectively, the file position for the data).

Note that this has a few implications:

  • Small data is grouped together, and the likely access method will group together commonly inserted values.
  • We won’t need to move the data if something changes (as long as it doesn’t grow too much), so updating the value will usually mean that we don’t need to update all the indexes (because the location on disk didn’t change), unless the value they are covering did change.
  • Trees are going to be smaller, allowing more of them to reside in memory, and it allows us to do interesting tricks with things like PrefetchVirtualMemory calls on the locations from the index before access them, so we only pay the I/O cost (if any, once).

This is also quite exciting, because it means that we can share indexes on the data very easily. For example, we can have a “etags per collection” index for each collection, which will be much faster to run because it doesn’t need all the extra lookups.

time to read 3 min | 516 words

I’m currently doing something that I would rather not do. I’m doing significant refactoring to the lowest level of RavenDB, preparing some functionality that I need to develop some use visible features. But in the meantime, I’m mucking about in the storage layer, dealing with how Voron actually persists and manage the information we have. And I’m making drastic changes. That means that stuff breaks, but we have got the tests to cover for us, so we are good in that regard, yeah!

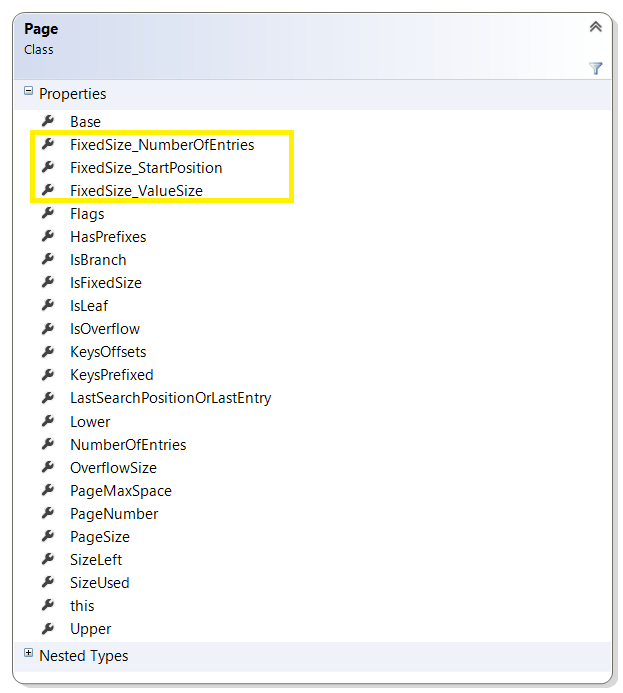
The case for this post is that I decided to break apart a class that had too many responsibilities. The class in question is:

image

As you can see, there are multiple concerns here. There are actually several types of Page in the system, but changing this would have been a major change, so I didn’t do that at the time, and just tucked more responsibility into this poor class.

When I finally got around to actually handling this, it was part of a much larger body of work, but I felt really great that I was able to do that.

Until I run the tests, and a few of them broke. In particular, only the tests that deal with large amount of information (over four million entries) broke. And they broke in a really annoying way, it looked like utter memory corruption was happening. It was scary, and it took me a long while to figure out what was going on.

Here is the fix:

image

This error happens when adding a new entry to a tree. In particular, this piece of code will only run when we have a page split on a branch page (that is, we need to move from 2 levels in the tree to 3 levels).

The issue turned out to be because when we split the Fixed Size Tree from the Variable Size Tree, I was able to save a single byte in the header of the fixed size tree page. The previous header was 17 bytes in size, and the new header was 16 bytes in size.

The size of BranchEntrySize is 16 bytes… and I think you get the error now, right?

Before, with page size of 4K, we had a PageMaxSize of 4079 bytes. So on the 255 entry, we would be over the limit, and split the page. By reducing a single byte from the header, the PageMaxSize was 4080, and because we only checked from greater than, we though that we could write to that page, but we ended up writing to the next page, corrupting it.

The fix, ironically enough, was to add another byte, to check for greater than or equal Smile.

time to read 1 min | 71 words

In this session, Oren explored how RavenDB deals with scaling under load and remain highly available even under failure conditions. Showed how RavenDB's data-driven sharding allows to increase the amount of the data in our cluster without giving up the benefits of data locality and work with complex distributed map-reduce queries on a sharded cluster, giving you lightning-fast responses over very large data volumes.

time to read 6 min | 1057 words

A customer called to complain that the indexing times that they were seeing on an index rebuild were very high, and that caused them issues. The customer was kind enough to actually provide us with a duplicate machine of their system, including duplicate data, which made the whole process so much easier. Unlike most scenarios, where we have to poke the logs, the debug endpoints and to try to figure out what is going on in a production system that we can’t really touch without causing downtime, here we had a complete freedom of action during the investigation.

The database in question is in the many tens of GB in size, and like most production databases, it has its own.. gravity, shall we say? Unlike a test data set where you can do something over the entire set and get immediate return, here the problem often was that to reproduce the issue we’ll have to start the action, then wait for ten or twenty minutes for it to pick up steam and actually start exhibiting the problem. But being able to actually run those tests repeatedly was very valuable in both narrowing down on exactly what was going on and how to resolve it.

The problem boiled down to an issue with how we were handling document prefetching. Before I get down into the details of that, let me explain what prefetching is.

Quite a lot of RavenDB code is concerned with reducing the time a request has to spend waiting for I/O. In particular, creation of a new index require us to read all the documents in the database so we can index them. On large databases, that can mean that we need to read tens of GB (and on very large databases, running an index that cover half a TB is very likely) from disk, index them, then write the index results to disk again.

Initially (as in, five or six years ago), we wrote the indexing code like so:

  • while (there are documents to index):
    • Load a batch of documents
    • Index those documents
    • Write them to disk

The problem is that this kind of code is very simple an easy to understand, but it also results in spending a lot of time doing:

  • Wait for load documents (no CPU usage)
  • Index documents (CPU usage)
  • Wait to write to disk (no CPU usage)

So a lot of the time was spent just waiting for I/O. Time that could have been much better spent doing something useful.

Because of that, we introduced the idea of prefetching. Basically, whenever we finish loading stuff from disk, we also immediately start a background task that will read the next batch of documents to member. The idea is that while we are indexing / writing the index results to disk, we’ll load the next batch of documents to memory, and we’ll have them immediately available to the indexing code, so we’ll have to do less waits, and we get the benefit of parallel I/O and execution.

This is a really high level overview of what is going on there, of course, and we need to balance quite a few competing concerns (memory, I/O pipeline size, I/O speed, other work being done, CPU utilization, etc, etc). But that is a pretty good description.

The problem in this case was that the customer in question have the following pattern of documents:

image

Our code mostly assumes that you have a roughly uniform distribution of documents sizes. Given the distribution above, assume we have a batch size of 2.

We’ll read the first two documents (taking 25Kb), and then start indexing them. At this time we start loading the next 2 documents. But the msgs/4 document is large, so it takes time to load, which means that indexing is now stalled on I/O.

What is work, the problem exacerbated, since the bigger documents tended to be toward the end (later documents tend to be bigger), it means that our heuristics about the data kept misleading us. Now, to make things worse, we actually do care about the size of the documents that we load, so instead of indexing the documents in big batches, those big documents would cause both I/O stalls, and then cause us to send much smaller batches to the indexes. That means that we have a lot more indexing batches, and a lot more I/O stalls.

The solution was to allow the prefetching code to give the indexes “whatever I have on hand”, and then continue with prefetching the additional documents while the indexes are working. It means more batches, but far less time waiting for the documents to be loaded from disk.

Another change we did was to parallelize the I/O further. When we notice that we get into this kind of situation, instead of firing off a single background task to load the next document batch, we are actually going to spin off multiple prefetching tasks, to load the next few batches in parallel. That means that we put more load on the I/O system, but especially on cloud machines, that is actually a  good thing (they they to have a shallow but wide I/O behavior).

Here the ability to actually test those changes on real system was invaluable, because our initial attempt was a bit… too active and actually placed serious I/O strain on the system, because we would try to make a lot of parallel reads for a lot of data at the same time. The implementation that we ended up with knows to scale the amount of pressure we put on the I/O system based on the actual system we use, the (current) I/O throughput we see, the document sizes in recent history, etc.

The end result is that we were able to shave about 20% – 25% of the indexing time under those conditions, and keep the system alive and functioning while we are doing so.

We also introduced the customer to the side by side, which allows them to deploy indexes in production without any interruption in service while the indexing is rebuilding. 

time to read 1 min | 159 words

In the previous posts, I discussed various options for accessing a value through a pointer, either by using a casted pointer, or casting it whenever we need to use it.

The good news from the benchmark is that all results are close enough to one another to be effectively equal. That means that there really isn’t any difference between the two options.

Except, that there is. By only having to keep track of a single pointer field (instead of two fields, one that is byte* and one that is PageHeader*), we can save a field. That means that we save 8 bytes on every page we allocate. And we can allocate a lot of pages.

The end result is that the casting approach is much faster, not because it runs faster, but because it reduces the size of allocations we make. And reducing the size of allocation end up using less memory, which end up being faster overall.

time to read 5 min | 900 words

So on my last post I showed a bunch of small micro benchmark, and aside from the actual results, I wasn’t really sure what was going on there. Luckily, I know a few perf experts, so I was able to lean on them.

In particular, the changes that were recommended were:

  • Don’t make just a single tiny operation, it is easy to get too much jitter in the setup for the call if the op is too cheap.
  • Pay attention to potential data issues, the compiler / jit can decide to put something on a register, in which case you are benching the CPU directly, which won’t be the case in the real world.

I also learned how to get the actual assembly being run, which is great. All in all, we get the following benchmark code:

[BenchmarkTask(platform: BenchmarkPlatform.X86,
            jitVersion: BenchmarkJitVersion.RyuJit)]
[BenchmarkTask(platform: BenchmarkPlatform.X86,
            jitVersion: BenchmarkJitVersion.LegacyJit)]
[BenchmarkTask(platform: BenchmarkPlatform.X64,
                jitVersion: BenchmarkJitVersion.LegacyJit)]
[BenchmarkTask(platform: BenchmarkPlatform.X64,
                jitVersion: BenchmarkJitVersion.RyuJit)]
public unsafe class ToCastOrNotToCast
{
    byte* p1, p2, p3, p4;
    FooHeader* h1, h2,h3,h4;
    public ToCastOrNotToCast()
    {
        p1 = (byte*)Marshal.AllocHGlobal(1024);
        p2 = (byte*)Marshal.AllocHGlobal(1024);
        p3 = (byte*)Marshal.AllocHGlobal(1024);
        p4 = (byte*)Marshal.AllocHGlobal(1024);
        h1 = (FooHeader*)p1;
        h2 = (FooHeader*)p2;
        h3 = (FooHeader*)p3;
        h4 = (FooHeader*)p4;
    }

    [Benchmark]
    [OperationsPerInvoke(4)]
    public void NoCast()
    {
        h1->PageNumber++;
        h2->PageNumber++;
        h3->PageNumber++;
        h4->PageNumber++;
    }

    [Benchmark]
    [OperationsPerInvoke(4)]
    public void Cast()
    {
        ((FooHeader*)p1)->PageNumber++;
        ((FooHeader*)p2)->PageNumber++;
        ((FooHeader*)p3)->PageNumber++;
        ((FooHeader*)p4)->PageNumber++;
    }
}

And the following results:

          Method | Platform |       Jit |   AvrTime |    StdDev |             op/s |
---------------- |--------- |---------- |---------- |---------- |----------------- |
            Cast |      X64 | LegacyJit | 0.2135 ns | 0.0113 ns | 4,683,511,436.74 |
          NoCast |      X64 | LegacyJit | 0.2116 ns | 0.0017 ns | 4,725,696,633.67 |
            Cast |      X64 |    RyuJit | 0.2177 ns | 0.0038 ns | 4,593,221,104.97 |
          NoCast |      X64 |    RyuJit | 0.2097 ns | 0.0006 ns | 4,769,090,600.54 |
---------------- |--------- |---------- |---------- |---------- |----------------- |
            Cast |      X86 | LegacyJit | 0.7465 ns | 0.1743 ns | 1,339,630,922.79 |
          NoCast |      X86 | LegacyJit | 0.7474 ns | 0.1320 ns | 1,337,986,425.19 |
            Cast |      X86 |    RyuJit | 0.7481 ns | 0.3014 ns | 1,336,808,932.91 |
          NoCast |      X86 |    RyuJit | 0.7426 ns | 0.0039 ns | 1,346,537,728.81 |

Interestingly enough, the NoCast approach is faster in pretty much all setups.

Here is the assembly code for LegacyJit in x64:

image

For RyuJit, the code is identical for the cast code, and the only difference in the no casting code is that the mov edx, ecx is mov rdx,rcx in RyuJit.

As an aside, X64 assembly code is much easier to read than x86 assembly code.

In short, casting or not casting has a very minor performance difference, but not casting allows us to save a pointer reference in the object, which means it will be somewhat smaller, and if we are going to have a lot of them, then that can be a pretty nice space saving.

time to read 3 min | 592 words

I’m doing some work to refactor a complex piece of code, and I have a piece of memory that is allocated, then accessed via a struct pointer. This piece of code gets called a lot, so I wondered about the tradeoff of holding a pointer that is already casted to the right struct pointer vs the cost of another pointer in the object.

Note, those are objects that are created a lot, and used a lot. Those are not the kind of things that you would usually need to worry about. Because I wasn’t sure, I decided to test this out. And I used BenchmarkDotNet to do so:

public struct FooHeader
{
    public long PageNumber;
    public int Size;
}

[BenchmarkTask(platform: BenchmarkPlatform.X86,
           jitVersion: BenchmarkJitVersion.LegacyJit)]
[BenchmarkTask(platform: BenchmarkPlatform.X64,
               jitVersion: BenchmarkJitVersion.LegacyJit)]
[BenchmarkTask(platform: BenchmarkPlatform.X64,
               jitVersion: BenchmarkJitVersion.RyuJit)]
public unsafe class ToCastOrNotToCast
{
    byte* p;
    FooHeader* h;
    public ToCastOrNotToCast()
    {
        p = (byte*)Marshal.AllocHGlobal(1024);
        h = (FooHeader*)p;
    }

    [Benchmark]
    public void NoCast()
    {
        h->PageNumber++;
    }

    [Benchmark]
    public void Cast()
    {
        ((FooHeader*)p)->PageNumber++;
    }

    [Benchmark]
    public void DirectCastArray()
    {
        ((long*)p)[0]++;
    }


    [Benchmark]
    public void DirectCastPtr()
    {
        (*(long*)p)++;
    }
}

The last two tests are pretty much just to have something to compare to, because if needed, I would just calculate memory offsets manually, but I doubt that those would be needed.

The one downside of BenchmarkDotNet is that it takes a very long time to actually run those tests. I’ll save you the suspense, here are the results:

image

I was expected the NoCast method to be faster, to be honest. But the Cast method is consistently (very slightly) the fastest one. Which is surprising.

Here is the generated IL:

image

And the differences in assembly code are:

image

Note that I’m not 100% sure about the assembly code. I got it from the disassembly windows in VS, and it is possible that it changed what is actually going on.

So I’m not really sure why this would be difference, and it is really is a small difference. But it is there.

FUTURE POSTS

  1. Partial writes, IO_Uring and safety - about one day from now
  2. Configuration values & Escape hatches - 5 days from now
  3. What happens when a sparse file allocation fails? - 7 days from now
  4. NTFS has an emergency stash of disk space - 9 days from now
  5. Challenge: Giving file system developer ulcer - 12 days from now

And 4 more posts are pending...

There are posts all the way to Feb 17, 2025

RECENT SERIES

  1. Challenge (77):
    20 Jan 2025 - What does this code do?
  2. Answer (13):
    22 Jan 2025 - What does this code do?
  3. Production post-mortem (2):
    17 Jan 2025 - Inspecting ourselves to death
  4. Performance discovery (2):
    10 Jan 2025 - IOPS vs. IOPS
View all series

Syndication

Main feed Feed Stats
Comments feed   Comments Feed Stats
}