Oren Eini

CEO of RavenDB

a NoSQL Open Source Document Database

Get in touch with me:

oren@ravendb.net +972 52-548-6969

Posts: 7,546
|
Comments: 51,161
Privacy Policy · Terms
filter by tags archive
time to read 4 min | 763 words

imageWe have been testing RavenDB in the harshest possible ways we can envision. Anything from simulating hardware failures to corrupting the network data to putting as much load as possible on the system. This is done as part of a long running test suite that has been running for the last few months. We have been stepping up the kind of things that we are doing in attempt to identify the weak points in RavenDB.

One of the interesting failure modes that we need to handle is what happens when the amount of work that is asked from the system exceeds the amount of resources that are available to it. At this point, what we want to do is to start failing gracefully. What we don’t want to do is to have the entire system grind to a halt of the server crashing.

There are problems with the idea that we can detect when we re in low resource mode and react accordingly. To start with, it is really hard. If the user paid for a fast machine, and we are running at 99% CPU, should we start rejecting requests? The users are actually getting their money’s worth from the hardware, so it make no sense to do that. Second, what is low resource mode? No space in hard disk is quite easy, actually. We detect that and error and everything is fine. High CPU is not something that we want to react to, it might be that we are actively handling a spike of traffic, or just making full use of the system.

Memory is another constrained resource, and here we run into our toughest problems. RavenDB uses memory mapped files for a lot of its storage needs, which means that high memory usage is something that we want, because it means that we are actually using the memory of the machine. Now, the OS can choose to evict such data from memory at any time very cheaply, so if there is a true memory pressure, we don’t need to worry, since there is a good degradation path for us.

The problem is that this isn’t the only cause for high memory usage. In additional to the actual memory we are using (the working set) there is also the commit charge for the system. I’m probably going to have a separate post to talk about the details of memory management from the OS point of view. The commit charge is how much memory the OS promised all the applications in the system. It is very common for applications to ask for a lot more memory than they actually need, which mean that the OS will usually not actually allocate the memory immediately. Instead, it will just record the promise to give it at a future date.

On Windows, the maximum commit charge is the size of the RAM and the page file(s) and Windows will flat out refuse to commit memory beyond that limit. When you are working on a system that is heavily overburdened, it is very possible to hit that limit, which is when… interesting things will happen.

In particular, we need to consider the behavior of failure to commit memory when we need to increase the size of the thread stack. In this case, even though the size of the stack is reasonable, there is no way to get more memory for the stack, and we’ll get a a fatal Stack Overflow exception. It looks like this exact behavior is very explicitly called in the code. This means that under low memory conditions (which may be low committed memory, not real low memory) opening a new thread, which may need to allocate / expand its stack, is a very dangerous behavior.

We have some code in RavenDB that spawn a new thread per connection for certain types of very long running server to server connections. Combine that we the fact that under such high load you’ll typically see disconnection and recovery by establishing a new connection (requiring a new thread) and you can see the problem. Under such load we’ll hit both conditions. Low committed memory and spawning of new threads, and then it is just a game of whatever it will be regular (and handled) allocation that fails or if it would be the stack extension that would fail, resulting in fatal error.

We are handling this by reusing the threads now, which seems to offer much greater stability in our test case.

time to read 2 min | 394 words

Sometimes we get requests from customers to evaluate and help specify the kind of hardware their RavenDB servers is going to run on. One of the more recent ones was to evaluate a couple of options and select the optimal one.

We got the specs of the two variants and had a look. Then I went and took a look at the actual costs. These are physical machines, and the cost of each of the options we were given, even maxed out, was around 2 – 3K $.

One of the machines that they wanted was using a 7,200 RPM hard disk and was somewhat cheaper than the other. To the point where we got some pushback from the customer about selecting the other option (with SSD). It took me a while to figure out what was going on.

This organization is using RavenDB (and the new machines in question) to run their core business. One of the primary factors in their business in the speed in which they can serve request (for that business, SEO is super critical metric). This business is also primarily focused on getting eyes on the site, which means that their organizational structure looks like this:

image

And the behavior of the organization follow the money. The marketing & sales department is much larger and can steer the entire organization, while the tech (which the entire organization depends on) is decidedly second string, for both decision making and budgeting.

I have run into this several times before, but it took me a long while to figure out that in many cases, the result of such arrangements is that the tech department relies on other people (in this case, us) to tell the organization at large what needs to be done. “It isn’t us (the poor relation) that needs this expensive (add 300$ or so) add on, but the database guys says that it really matters (and you’ll take the blame if you don’t approve it)”.

I don’t have anything to add, I’m afraid, I just wanted to share this observation. I’m hoping that understanding the motivation can help alleviate some of the hair pulling involved in those kind of interactions (yes, water is wet, and spending a very small amount of money is actually worth it).

time to read 5 min | 956 words

animal-1299573_640When your back is against the wall, and your only hope is for black magic (and alcohol).

The title of this post is taken from this song. The topic of this post is a pretty sad one, but a mandatory discussion when dealing with data that you don’t want to lose. We are going to discuss hard system failures.

The source can be things like actual physical disk errors to faulty memory causing corruption. The end result is that you have a database that is corrupted in some manner. RavenDB actually have multiple levels of protections to detect such scenarios. All the data is verified with checksums on first load from the disk, and the transaction journal is verified when applying it as well. But stuff happens, and thanks to Murphy, that stuff isn’t always pleasant.

One of the hard criteria for the Release Candidate was a good story around catastrophic data recovery. What do I mean by that? I mean that something corrupted the data file in such a way that RavenDB cannot load normally. So sit on tight and let me tell you this story.

We first need to define what we are trying to handle. The catastrophic data recovery feature is meant to:

  1. Recover user data (documents, attachments, etc) stored inside a RavenDB file.
  2. Recover as much data as possible, disregarding its state, letting user verify correctness (i.e, may recover deleted documents).
  3. Does not include indexed data, configuration, cluster settings, etc. This is because these can be quite easily handled by recreating indexes or setting up a new cluster.
  4. Does not replace high availability, backups or proper preventive maintenance.
  5. Does not attempt to handle malicious corruption of the data.

Basically. the idea is that when you are shit creek, we can hand you paddle. That said, you are still up in shit creek.

I mentioned previously that RavenDB go to quite some length to ensure that it knows when the data on disk is messed up. We also did a lot of work into making sure that when needed, we can actually do some meaningful work to extract your data out. This means that when looking at the raw file format, we actually have extra data there that isn’t actually used for anything in RavenDB except by the recovery tools. That reason (the change to the file format) was why it was a Stop-Ship priority issue.

Given that we are already in catastrophic data recovery mode, we can make very little assumption about the state of the data. A database is a complex beast, involving a lot of moving parts and the on disk format is very complex and subject to a lot of state and behavior. We are already in catastrophic territory, so we can’t just use the data as we would normally would. Imagine a tree where following the pointers to the lower level might at some cases lead to garbage data or invalid memory. We have to assume that the data has been corrupted.

Some systems handle this by having two copies of the master data records. Given that RavenDB is assumed to run on modern file systems, we don’t bother this. ReFS on Windows and ZFS on Linux handle that task better and we assume that production usage will use something similar. Instead, we designed the way we store the data on disk so we can read through the raw bytes and still make sense of what is going on inside it.

In other words, we are going to effectively read one page (8KB) at a time, verify that the checksum matches the expected value and then look at the content. If this is a document or an attachment, we can detect that and recover them, without having to understand anything else about the way the system work. In fact, the recovery tool is intentionally limited to a basic forward scan of the data, without any understanding of the actual file format.

There are some complications when we are dealing with large documents (they can span more than 8 KB) and large attachments (we support attachments that are more then 2GB in size) can requite us to jump around a bit, but all of this can be done with very minimal understanding of the file format. The idea was that we can’t rely on any of the complex structures (B+Trees, internal indexes, etc) but can still recover anything that is still recoverable.

This also led to an interesting feature. Because we are looking at the raw data, whenever we see a document, we are going to write it out. But that document might have actually been deleted. The recovery tool doesn’t have a way of checking (it is intentionally limited) so it just write it out. This means that we can use the recovery tool to “undelete” documents. Note that this isn’t actually guaranteed, don’t assume that you have an “undelete” feature, depending on the state of the moon and the stomach content of the nearest duck, it may work, or it may not.

The recovery tool is important, but it isn’t magic, so some words of caution are in order. If you have to use the catastrophic data recovery tool, you are in trouble. High availability features such as replication and offsite replica are the things you should be using, and backups are so important I can’t stress it enough.

The recommended deployment for RavenDB 4.0 is going to be in a High Availability cluster with scheduled backups. The recovery tool is important for us, but you should assume from the get go that if you need to use it, you aren’t in a good place.

time to read 2 min | 324 words

imageRavenDB 4.0 is going to have a completely free community edition that you could use to run production systems. We do this with the expectation that users will go with the community edition and either will be happy there or upgrade at some point to the commercial editions.

As part of the restructuring we are doing, we intend to also significantly simplify the support model. Our current support model is per RavenDB instance with professional support costing 2,000$ per instance and production (24/7) support costing 6,000$. We got a lot of feedback on this being complex to work with. In particular, the per instance cost meant that operations would need to talk to us during redeployments in order to maintain coverage of all their RavenDB instances.

As part of the Great Simplification we do in 4.0 we also want to tackle the issue of support. As a result, with the rollout of the RavenDB 4.0 RC we are going to move to flat support costs.

  • Professional Support will cost 15% of the license cost and give you access to our support engineers with a guaranteed next business day response time.
  • Production Support will cost 30% of the license cost and give you access to the core team members with 24/7 availability.

This is a significant reduction in price, because we are trying to encourage more people to get support and our previous approach was unbalanced.

The community support will continue to be offered, obviously, but we have no SLA around issues raised there.

The commercial support options will only be available for the Professional and Enterprise editions.

Here is how the costs change between RavenDB 3.x and RavenDB 4.5 for production support:

RavenDB 3.x RavenDB 4.0 Savings
Standard +
Production
Support

6,698$

5,843$

15% reduction

Enterprise 4 Cores +

Production Support

9,152$6,864$33% reduction
time to read 3 min | 522 words

1329757286-300pxWe got a puzzle. A particular customer was seeing very high latency in certain operations on a fairly frequent basis. The problem is that when this happened, the server was practically idle, serving around 5% of the usual requests/sec. What was even stranger was that during the times when we had reached the peek of requests/seconds, we’ll see no such slowdowns. The behavior was annoyingly consistent, we’ll see no slowdown at all during high load, but after a period of relatively light load, the server would appear to choke.

That one took a lot of time to figure out, because it was so strange. The immediate cause was pretty simple to figure out, the server was busy paging into memory a lot of data, but why would it need to do this? The server was just sitting there doing nothing much, but it was thrashing like crazy, and that was affecting the entire system.

I’ll spare you the investigation, because it was mostly grunting and frustration, but the sequence of events as we pieced it together was something like this:

  • The system is making heavy use of caching, with a cache duration set to 15 minutes or so. Most pages would hit the cache first, and if there was a miss, generate it and save it back. The cached documents was setup with the RavenDB expiration bundle.
  • During periods of high activity, we’ll typically have very few cache expiration (because we kept using the cached data) and we’ll fill up the cache quite heavily (the cache db was around 100GB or so).
  • That would work just fine and rapidly be able to serve a high number of requests.
  • And then came the idle period…
  • During that time, we had other work (by a different process) going on in the server, which we believe would give the OS reason to page the now unused memory to disk.

So far, everything goes on as predicted, but then something happens. The expiration timer is hit, and we now have a lot of items that need to be expired. RavenDB expiration is coarse, and it runs every few minutes, so each run we had a lot of stuff to delete. Most of it was on disk, and we needed to access all of it so we can delete it. And that caused us to trash, affecting the overall server performance.

As long as we were active, we wouldn’t expire so much at once, and we had a lot more of the db in memory, so the problem wasn’t apparent.

The solution was to remove the expiration usage and handle the cache invalidation in the client, when you fetched a cached value, you checked its age, and then you can apply a policy decision if you wanted to update it or not. This actually turned out to be a great feature in general for that particular customer, since they had a lot of data that can effectively be cached for much longer periods, and that gave them the ability to express that policy.

time to read 4 min | 735 words

In the previous part, I looked at how indexing and queries are handled in Resin. This post is mostly about the pieces I haven’t talked about so far. We’ll start with the query parser and move to the trie.

Queries in Resin looks like this:

image

This is sort of looking like the Lucene syntax, but it looks like it keeps the same context until a new field comes along.

Range queries looks better, sort of:

image

I had a hard time figuring this one out, until I realized that this is not an XML tag in the middle.

The problem is that the Lucene query syntax kinda sucks. Actually, it sucks a lot. It is complex and ambiguous to parse and it is full of all those little things like the ~ over there that is not very obvious but is very important to the query. I would actually suggest something more like SQL. Sure, that wouldn’t be what you’ll put in the search box, but programmers will appreciate you for that.

Looking at the parser code, there aren’t any surprises there. It is using a hard rolled system using regex and split, which can be vastly improved. One thing to note is that because of the simplicity of the parser, it isn’t really able to process things like a search for a token with a colon in it, so it can’t process this query: 

url:http://ayende.com

Anyway, the query parser isn’t really the most important thing here. The core of Resin, and what I haven’t looked at so far at all is the trie…

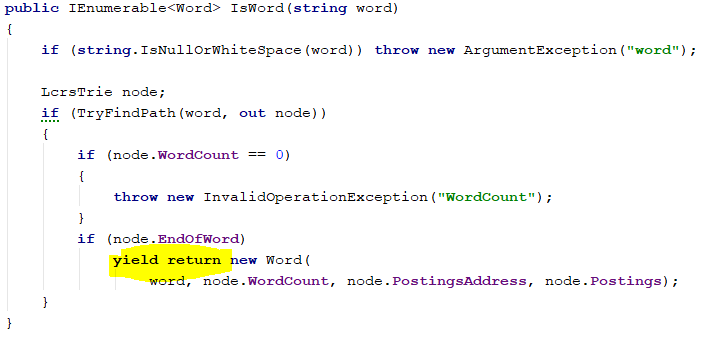
LcrsTrie stands for Left child Right sibling, there is a good discussion on the reasons why you’ll want to use this here. At this point, I’m not really sure why the choice of Lcrs was used. In general, they are used to reduce space and simplify the representation, but I don’t think that this is a good idea for a persistent structure. I’ll look at that later. Right now I’m reading the code, and it is mostly pretty obvious code. But then you get to this:

image

This pattern of using IEnumerable to return a single value is something that I’ve seen in other places in the codebase, and I don’t really get it.

I like the use of the Levenshtein distance in fuzzy search, mostly because we don’t need to store a lot of data to get fuzzy search working. In particular, it looks like suggestion style queries are pretty easy, and would be much cheaper then it would be in Lucene.

Probably the core operation you always perform on a trie is the search, and the core of that in this case is the TryFindPath method:

There is nothing surprising in this code, but it is a pure in memory implementation, which is a very different environment then a persistent data structure.

The persistent data structure is actually the MappedTrieReader, so let us examine it. Looking at it, there is some reference to the notions of segments within the file, but I’m not seeing where it is used. This is what the “*.six” file is used for, it seems. I think that this might be related to merging, but I don’t really know.

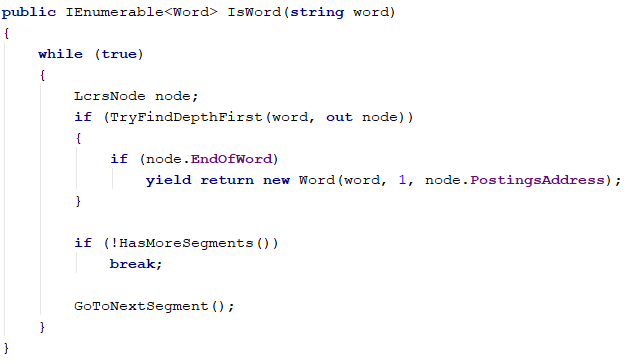
And here is the reason for the IsWord design:

image

When using a single LcrsTrie, it isn’t needed. But when using a possibly segmented reader, we might have multiple results for the same word.

What is worrying here is that the same access pattern for the trie that is used in memory is also using in the persistent mode. That means that each time we need to traverse the trie, we’ll need to seek. Actually, it looks like that might only be needed when we aren’t on the right path, but that is actually pretty common, so there are going to be a lot of seeks.

That is enough for now, my next post will be more detailed analysis of the Resin I/O structure and what I would probably do instead.

time to read 3 min | 454 words

imageThe nightmare scenario for a database vendor is something like this: Over 27,000 databases managed by MongoDB held to ransom; 99,000 still vulnerable.

To be fair, this isn’t quite the nightmare scenario. The nightmare scenario would be if this would be due to some vulnerability in the database, but in this case, this isn’t that at all. It is simply that admins have setup a publicly visible database with no permissions on the internet, and said “okay, we are done, what is the next ticket?”.

Now, I presume that it didn’t really went on like that, but the problem is that if you follow the proper instructions, you are fine, by default, all your data is exposed over the network. I’m assuming that a few of those were setup by a proper dev ops team, and mostly they were done by “Joe, we are going to prod, here are the server credentials, make sure that the db is running there”.  Or, also likely, “We are done with dev, we can just use the same servers for prod”, with no one going in and setting them up properly.

You should note that this isn’t really about MongoDB specifically (although this is the one that has the most noise at the moment). This makes for a pretty sad reading, you literally require nothing to do to “hack” into production systems, and access over 600 TB of data (just for MongoDB).

The scary thing is that you have questions like this: bind_ip = 127.0.0.1 does not work but 0.0.0.0 works.

So the user will actively try to fight any measure you have to protect them.

With RavenDB, we have actually made it a startup error (the server will abort) if you are running a production instance (identified with a license) but you don’t require authentication. Now, there are scenarios where this is valid, such as running on a secured network, but they are pretty far, so you have a configuration option that you can set that will enable this scenario, but that require an explicit step and hopefully get the user thinking. With RavenDB 4.0, we’ll require authentication (or explicit configuration override) whenever a user ask us to bind to an interface other than localhost.

I think that is one case where you have to reverse “let’s make it easy to use us” and also consider putting hurdles to actually get it running. Because in the long run, getting this wrong means that it is very easy to shoot yourself in the foot.

time to read 4 min | 660 words

As you read this post, you might want to also consider letting this play in the background. We had a UDP port leak in RavenDB. We squashed it like a bug, but somehow it kep repeating.


We found one cause of it (and fixed it), finally. That was after several rounds of looking at the code and fixing a few “this error condition can lead to the socket not being properly disposed”.

Finally, we pushed to our own internal systems, and monitored things, and saw that it was good. But the bloody bug kept repeating. Now, instead of manifesting as thousands of UDP ports, we had just a dozen or so, but they were (very) slowly increasing. And it drove us nuts. We had logging there, and we could see that we didn’t had the kind of problems that we had before. And everything looked good.

A full reproduction of the issue can be here, but the relevant piece of code is here:

Timer timer = new Timer(async state =>
{
    try
    {
        var addresses = await Dns.GetHostAddressesAsync("time.nasa.gov");
        var endPoint = new IPEndPoint(addresses[0], 123);

        using (var udpClient = new UdpClient())
        {
            udpClient.Connect(endPoint);
            udpClient.Client.ReceiveTimeout = 100;
            udpClient.Client.SendTimeout = 100;
            await udpClient.SendAsync(new byte[] {12, 32, 43}, 3);
            await udpClient.ReceiveAsync();
        }
    }
    catch (Exception e)
    {
        Console.WriteLine(e);
        Environment.Exit(-1);
    }
});
timer.Change(500, 500);

As you can see, we are issuing a request to a time server, wrap the usage of the UDP socket in a using statement, make sure to have proper error handling, setup the proper timeouts, the works.

Our read code is actually awash with logging, detailed error handling, and we poured over that a crazy amount of time to figure out what was going on.

If you run this code, and watch the number of used TCP ports, you’ll see a very curious issue. It is always increasing. What is worse, there are no errors, nothing. It just goes into a black hole in the sky and doesn’t work.

In this case, I’ve explicitly created a malformed request, so it is expected that the remote server will not reply to me. That allows us to generate the proper scenario. In production, of course, we send the right value, and we typically get the right result, so we didn’t see this.

The error we had was the timeout values. The documentation quite clearly states that they apply to the syncronous method only, and since they don’t say a word about the async method, this does not apply to the async methods. Given how UDP works, that makes perfect sense. To support timeout on the async methods, the UdpClient would need to start a timer to do so.  However, given the API, it is very easy to see how we kept missing this.

The real issue is that when we make a request to a server, and for whatever reason, the UDP reply packet is dropped, we just hang in an async manner. That is, we have an async call that will never return. That call holds the UDP port open, and over time, that shows up as a leak. That is pretty horrible, but the good thing is that once we knew what the problem was, fixing it was trivial.

time to read 6 min | 1057 words

A customer called to complain that the indexing times that they were seeing on an index rebuild were very high, and that caused them issues. The customer was kind enough to actually provide us with a duplicate machine of their system, including duplicate data, which made the whole process so much easier. Unlike most scenarios, where we have to poke the logs, the debug endpoints and to try to figure out what is going on in a production system that we can’t really touch without causing downtime, here we had a complete freedom of action during the investigation.

The database in question is in the many tens of GB in size, and like most production databases, it has its own.. gravity, shall we say? Unlike a test data set where you can do something over the entire set and get immediate return, here the problem often was that to reproduce the issue we’ll have to start the action, then wait for ten or twenty minutes for it to pick up steam and actually start exhibiting the problem. But being able to actually run those tests repeatedly was very valuable in both narrowing down on exactly what was going on and how to resolve it.

The problem boiled down to an issue with how we were handling document prefetching. Before I get down into the details of that, let me explain what prefetching is.

Quite a lot of RavenDB code is concerned with reducing the time a request has to spend waiting for I/O. In particular, creation of a new index require us to read all the documents in the database so we can index them. On large databases, that can mean that we need to read tens of GB (and on very large databases, running an index that cover half a TB is very likely) from disk, index them, then write the index results to disk again.

Initially (as in, five or six years ago), we wrote the indexing code like so:

  • while (there are documents to index):
    • Load a batch of documents
    • Index those documents
    • Write them to disk

The problem is that this kind of code is very simple an easy to understand, but it also results in spending a lot of time doing:

  • Wait for load documents (no CPU usage)
  • Index documents (CPU usage)
  • Wait to write to disk (no CPU usage)

So a lot of the time was spent just waiting for I/O. Time that could have been much better spent doing something useful.

Because of that, we introduced the idea of prefetching. Basically, whenever we finish loading stuff from disk, we also immediately start a background task that will read the next batch of documents to member. The idea is that while we are indexing / writing the index results to disk, we’ll load the next batch of documents to memory, and we’ll have them immediately available to the indexing code, so we’ll have to do less waits, and we get the benefit of parallel I/O and execution.

This is a really high level overview of what is going on there, of course, and we need to balance quite a few competing concerns (memory, I/O pipeline size, I/O speed, other work being done, CPU utilization, etc, etc). But that is a pretty good description.

The problem in this case was that the customer in question have the following pattern of documents:

image

Our code mostly assumes that you have a roughly uniform distribution of documents sizes. Given the distribution above, assume we have a batch size of 2.

We’ll read the first two documents (taking 25Kb), and then start indexing them. At this time we start loading the next 2 documents. But the msgs/4 document is large, so it takes time to load, which means that indexing is now stalled on I/O.

What is work, the problem exacerbated, since the bigger documents tended to be toward the end (later documents tend to be bigger), it means that our heuristics about the data kept misleading us. Now, to make things worse, we actually do care about the size of the documents that we load, so instead of indexing the documents in big batches, those big documents would cause both I/O stalls, and then cause us to send much smaller batches to the indexes. That means that we have a lot more indexing batches, and a lot more I/O stalls.

The solution was to allow the prefetching code to give the indexes “whatever I have on hand”, and then continue with prefetching the additional documents while the indexes are working. It means more batches, but far less time waiting for the documents to be loaded from disk.

Another change we did was to parallelize the I/O further. When we notice that we get into this kind of situation, instead of firing off a single background task to load the next document batch, we are actually going to spin off multiple prefetching tasks, to load the next few batches in parallel. That means that we put more load on the I/O system, but especially on cloud machines, that is actually a  good thing (they they to have a shallow but wide I/O behavior).

Here the ability to actually test those changes on real system was invaluable, because our initial attempt was a bit… too active and actually placed serious I/O strain on the system, because we would try to make a lot of parallel reads for a lot of data at the same time. The implementation that we ended up with knows to scale the amount of pressure we put on the I/O system based on the actual system we use, the (current) I/O throughput we see, the document sizes in recent history, etc.

The end result is that we were able to shave about 20% – 25% of the indexing time under those conditions, and keep the system alive and functioning while we are doing so.

We also introduced the customer to the side by side, which allows them to deploy indexes in production without any interruption in service while the indexing is rebuilding. 

time to read 1 min | 100 words

The following is a really good study on real world production crashes:

Simple Testing Can Prevent Most Critical Failures:
An Analysis of Production Failures in Distributed
Data-Intensive Systems

It makes for fascinating reading, especially since the include the details of the root cause of some of the errors. I wasn’t sure whatever to cringe or sympathize Open-mouthed smile.

image

FUTURE POSTS

  1. Partial writes, IO_Uring and safety - about one day from now
  2. Configuration values & Escape hatches - 5 days from now
  3. What happens when a sparse file allocation fails? - 7 days from now
  4. NTFS has an emergency stash of disk space - 9 days from now
  5. Challenge: Giving file system developer ulcer - 12 days from now

And 4 more posts are pending...

There are posts all the way to Feb 17, 2025

RECENT SERIES

  1. Challenge (77):
    20 Jan 2025 - What does this code do?
  2. Answer (13):
    22 Jan 2025 - What does this code do?
  3. Production post-mortem (2):
    17 Jan 2025 - Inspecting ourselves to death
  4. Performance discovery (2):
    10 Jan 2025 - IOPS vs. IOPS
View all series

Syndication

Main feed Feed Stats
Comments feed   Comments Feed Stats
}