Oren Eini

CEO of RavenDB

a NoSQL Open Source Document Database

Get in touch with me:

oren@ravendb.net +972 52-548-6969

Posts: 7,546
|
Comments: 51,161
Privacy Policy · Terms
filter by tags archive
time to read 3 min | 559 words

I believe that I have mentioned that my major problem with the memory usage in the profiler is with strings. The profiler is doing a lot with strings, queries, stack traces, log messages, etc are all creating quite a lot of strings that the profiler needs to inspect, analyze and finally produce the final output.

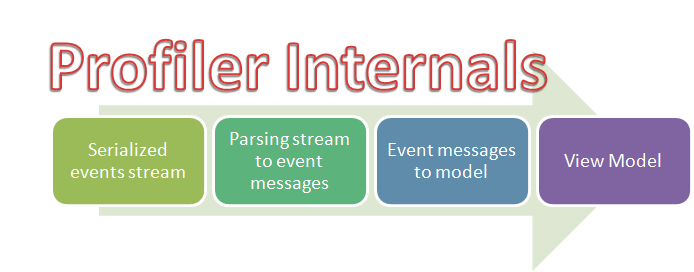
Internally, the process looks like this:
image

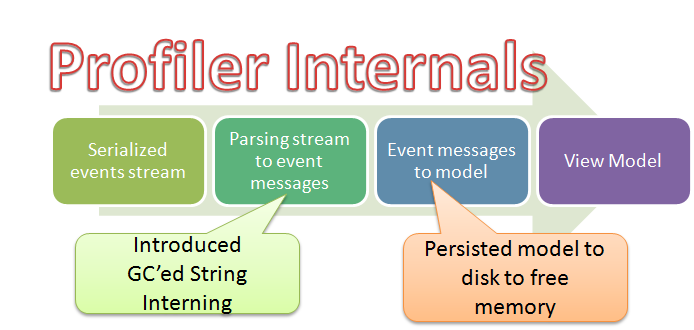
On my previous post, I talked about the two major changes that I made so far to reduce memory usage, you can see them below. I introduced string interning in the parsing stage and serialized the model to disk so we wouldn’t have to keep it all in memory, which resulted in the following structure:

image

However, while those measures helped tremendously, there is still more that I can do. The major problem with string interning is that you first have to have the string in order to check it in the interned table. That means that while you save on memory in the long run, in the short run, you are still allocating a lot of strings. My next move is to handle interning directly from buffered input, skipping the need to allocate memory for a string to use as the key for interning.

Doing that has been a bit hard, mostly because I had to go deep into the serialization engine that I use (Protocol Buffers) and add that capability. It is also fairly complex to handle something like this without having to allocating a search key in the strings table. But, once I did that, I noticed three things.

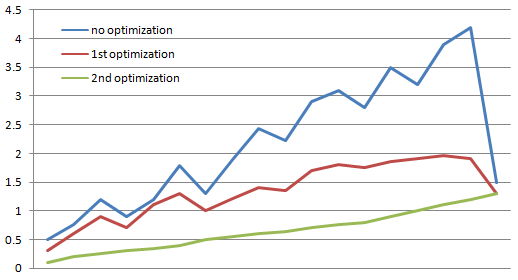
First, while memory increased during operation, there weren’t any jumps & drops, that is, we couldn’t see any periods in which the GC kicked in and released a lot of garbage. Second, memory consumption was relatively low through the operation. Before optimizing the memory usage, we are talking about 4 GB for processing and 1.5 GB for final result, after the previous optimization it was 1.9 GB for processing and 1.3 for final result. But after this optimization, we have a fairly simple upward spike up to 1.3 GB. You can see the memory consumption during processing in the following chart, memory used in in GB on the Y axis.

image

As you can probably tell, I am much happier with the green line than the other. Not only just because it takes less memory in general, but because it is much more predictable, it means that the application’s behavior is going to be easier to reason about.

But this optimization brings to mind the question, since I just introduced interning at the serialization level, do I really need to have interning at the streaming level? On the face of it, it looks like an unnecessary duplication. Indeed, removing the string interning that we did in the streaming level reduce overall memory usage from 1.3GB to 1.15GB.

Overall, I think this is a nice piece of work.

time to read 8 min | 1554 words

"We should forget about small efficiencies, say about 97% of the time: premature optimization is the root of all evil" - Donald Knuth

I have expressed my dislike for micro benchmarks in the past, and in general, I still have this attitude, but sometimes, you really care.

A small note, while a lot of namespaces you are going to see are Google.ProtocolBuffers, this represent my private fork of this library that was customized to fit UberProf’s needs. Some of those things aren’t generally applicable (like string interning at the serialization level), so please don’t try to project from the content of this post to the library itself.

Let me show you what I mean:

image

The following is profiling this piece of code:

private static bool StringEqaulsToBuffer(ByteString byteString, ByteBuffer byteBuffer)
{
    if(byteString.Length != byteBuffer.Length)
        return false;
    for (int i = 0; i < byteString.Length; i++)
    {
        if(byteString[i] != byteBuffer.Buffer[byteBuffer.Offset+i])
            return false;
    }
    return true;
}

This looks pretty simple right?

Now, it is important to understand that this isn’t some fake benchmark that I contrived, this is the profile results from testing a real world scenario. In general, methods such as Equals or GetHashCode, or anything that they call, is likely to be called a lot of times, so paying attention to its performance is something that you should think about.

This are a couple of very easy things that I can do to make this easier, remove the call to the ByteString indexer (which show up as get_Item in the profiler results) to a direct array access and consolidate the calls to the ByteString.Length property.

After applying those two optimizations, we get the following code:

private static bool StringEqaulsToBuffer(ByteString byteString, ByteBuffer byteBuffer)
{
    var strLen = byteString.Length;
    if(strLen != byteBuffer.Length)
        return false;
    for (int i = 0; i < strLen; i++)
    {
        if(byteString.bytes[i] != byteBuffer.Buffer[byteBuffer.Offset+i])
            return false;
    }
    return true;
}

And this profiler result:

image

You can see that the this simple change resulted in drastic improvement to the StringEqualsToBuffer mehtod. As it stands now, I don’t really see a good way to optimize this any further, so I am going to look at the other stuff that showed up. Let us take a look at ByteBuffer.GetHashCode() now:

public override int GetHashCode()
{
    var ret = 23;
    for (var i = Offset; i < Offset+Length; i++)
    {
        ret = (ret << 8) | Buffer[i];
    }
    return ret;
}

The problem is that I don’t really see a way to optimize that, instead, I am going to cache that in a field. There is some problem here with the fact that ByteBuffer is mutable, but I can handle that by forcing all call sites that change it to call a method that will force hash recalculation. Note how different this decision is from the usual encapsulation that I would generally want. Placing additional burdens on call sites is a Bad Thing, but by doing so, I think that I can save quite significantly on the hash code calculation overhead.

Next, let us look at the DoCleanupIfNeeded method and see why it is taking so much time.

private void DoCleanupIfNeeded()
{
    if (strings.Count <= limit)
        return;

    // to avoid frequent thrashing, we will remove the bottom 10% of the current pool in one go
    // that means that we will hit the limit fairly infrequently
    var list = new List<KeyValuePair<ByteStringOrByteBuffer, Data>>(strings);
    list.Sort((x, y) => x.Value.Timestamp - y.Value.Timestamp);

    for (int i = 0; i < limit/10; i++)
    {
        strings.Remove(list[i].Key);                
    }
}

From the profiler output, we can see that it is an anonymous method that is causing the holdup, that is pretty interesting, since this anonymous method is the sort lambda. I decided to see if the BCL can do better, and changed that to:

private void DoCleanupIfNeeded()
{
    if (strings.Count <= limit)
        return;

    // to avoid frequent thrashing, we will remove the bottom 10% of the current pool in one go
    // that means that we will hit the limit fairly infrequently
    var toRemove = strings.OrderBy(x=>x.Value.Timestamp).Take(limit/10).ToArray();

    foreach (var valuePair in toRemove)
    {
        strings.Remove(valuePair.Key);                
    }
}

This isn’t really what I want, since I can’t take a dependency on v3.5 on this code base, but it is a good perf test scenario. Let us see what the profiler output is after those two changes:

image

This is much more interesting, isn’t it?

First, we can see that the call to ByteBuffer.GetHashCode went away, but we have a new one, ByteBuffer.ResetHash. Note, however, that ResetHash only took half as much time as the previous appearance of GetHashCode and that it is called only half as many times. I consider this a net win.

Now, let us consider the second change that we made, where previously we spend 11.1 seconds on sorting, we can see that we now spend 18 seconds, even if the number of calls is so much lower. That is a net lose, so we will revert that.

And now, it is the time for the only test that really matters, is it fast enough? I am doing that by simply running the test scenario outside of the profiler and checking to see if its performance is satisfactory. And so far, I think that it does meet my performance expectation, therefore, I am going to finish with my micro optimizations and move on to more interesting things.

time to read 3 min | 597 words

When I started looking into persisting profiler objects to disk, I had several factors that I had to take into account:

  • Speed in serializing / deserializing.
  • Ability to intervene in the serialization process at a deep level.
  • Size (also effect speed).

The first two are pretty obvious, but the third requires some explanation. The issue is, quite simply, that I can apply some strategies to significantly reduce both speed & size of serialization by making sure that the serialization pipeline knows exactly what is going on (string tables & flyweight objects).

I started looking into the standard .NET serialization pipeline, but that was quickly ruled out. There are several reasons for that, first, you literally cannot hook deep enough into the serialization pipeline to do the sort of things that I wanted to do (you cannot override how System.String get persisted), and it is far too slow for my usages.

My test data started as a ~900Mb of messages, which I loaded into the profiler (resulting in a 4 GB footprint during processing and a 1.5GB footprint when processing is done). Persisting the in memory objects using BinaryFormatter resulted in a file whose size is 454Mb and whose deserialization I started before I started writing this post and at this point in time has not completed yet. Currently the application (simple cmd line test app that only does deserialization, takes 1.4 GB).

So that was utterly out. So I set out to write my own serialization format. Since I wanted it to be fast, I couldn’t use reflection, (BF app currently takes 1.6 GB) but by the same token, writing serialization by hand is labor intensive, error prone method. That lives aside the question of handling changes in the objects down the road, that is not something that I would like to do.

Having come to that conclusion, I decided to make use of CodeDOM to generate a serialization assembly on the fly. That would give me the benefits of no reflection, handle addition of new members to the serialized objects and would allow me to incrementally improve how (BF app now takes 2.2 GB, and I am getting ready to kill it). My first attempt in doing so, applying absolutely not optimization techniques, result in a 381 Mb file and an 8 seconds parsing time.

That is pretty good, but I wanted to do a bit more.

Now, note that this is an implementation specific for a single use. After applying a simple string table optimization, the results of the serialization are two files, the string table is 10Mb in length and the actual saved data is 215Mb and de-serialization takes ~10 seconds. Taking a look at what actually happened, it looked like the cost of maintaining string table is quite high. Since I care more about responsiveness than file size, and since the code for maintaining the string table is complex, I dropped that in favor of in memory only MRU string interning.

Initial testing shows that this should be quite efficient in reducing memory usage. In fact, in my test scenario, memory consumption during processing dropped down 4 GB to just 1.8 – 1.9 GB and 1.2 GB when processing is completed. And just using the application shows that the user level performance is pretty good, even if I say so myself.

There are additional options that I intend to take, but I’ll talk about them in a later post.

time to read 5 min | 902 words

The major goal that I had in mind for the profiler was online development usage. That is, do something, check the profiler, clear it, do something else, etc. One of the things that I am finding out is that people use it a lot more as a dumping ground. They push a lot of information into it, and then want to sift through that and look at how the application behave, not just a single scenario.

Surprisingly, it works quite well, especially with the recently implemented performance profiling sessions that we just run through. One scenario, however, remains stubbornly outside what the profiler can currently do. When people talk to me about it, they call it load tests profiling, or integration tests profiling. This is when you pour literally gigabytes of information into the profiler. And it works, provided you have enough memory, that is.

If you don’t have enough memory, however, you get to say hello to OutOfMemoryException.

When I dove into this problem I was sure that I would simply find that there is something stupid that I am doing wrong, and that as soon as I’ll figure it out, it will be all right. I actually did find a few places where I could optimize memory usage (reducing lambda usage in favor of cached delegates to named methods, for example), but that only shaved a few percentage points. Trying out string interning actually resulted in a huge saving in memory, but I feel that this is just a stop gag measure. I have to persist the data to disk, rather than keep it in memory.

That lead me to a very interesting problem. What I need is basically a key value store. Interestingly enough, I already wrote one. The problem is that while this would work great right now, I have future plans which means depending on Esent is an… unwise choice. Basically, I would like to be able to run on Mono and/or Silverlight and that rules out using a Windows only / full trust native dll. As they say, a bummer. That requirement also rules out using the various embedded databases as well.

I considered ignoring this requirement and handling it when the times come, but I decided that since this is going to majorly effect how I am going to use it, I can’t really afford to delay that decision. With that in mind, I set out to figure out what I needed:

  • A fast way to store / retrieve a session information along with its associated data (stack trace, alerts, statistics, etc).
  • Ability to store, at a minimum, tens of thousands of items of variable size.
  • A single file (or at least, very few files) – cannot afford to have one item per file (it usually kills the FS).
  • Support updates without re-writing the entire file.
  • Usable from Mono & Silverlight, or easily portable to them.

With that in mind, I decided to take a look at what is already out there.

  • C#-Sqlite looked like it might be the ticker. It is a C# port of the Sqlite database. Unfortunately, I took a look at the code base and it is a port to C#, the code gave me the willies. I don’t feel that I can trust it, and at any rate, it would require me to write a lot of data access code, that is a thing that I am trying to avoid :-). (And no, you can’t use NHibernate with that version, you would have to port the ADO.Net driver as well, and then you wouldn’t be able to use it in Silverlight anyway.)
  • Caching Application Block – because it looked like it had a persistent solution already. That persistent solution is based on several files per item, which is not acceptable. I already tried that route in the past, it is a good way to kill your file system.
  • SilverDB – this is an interesting code base, and a good solution for the problem it is meant to (saving relatively small amount of information to disk). However, I need to save large amounts of information, and I need to handle a lot of updates. SilverDB re-write the entire file whenever it is saving. That has too high a perf cost for my needs.
  • TheCache – I took only a brief look here, but it looks that it is too heavily focused on being a cache to be useful for my purposes.

In fact, given my requirements, it might be interesting to see what I don’t need.

  • Not reliable.
  • Not thread safe.
  • Saving is just a way to free memory.

Given that, I decided to go with the following method:

  • Custom serialization format, allowing me to save space & time using file & memory based string interning.
  • No persistent file index, that can be kept directly in memory.
  • Persisted string interning file.

As you can see, this is a very tailored solution, not something that would be generally useful, but I have great hopes for this.

time to read 4 min | 653 words

Since I know people will want the actual implementation, here is a simple way of handling string interning in a way that will allow you to GC the results at some point. The issue is simple, I want to intern strings (so a string value is only held once through my entire app), but I don’t want to be stuck with them if the profiler state has been clear, for example.

public class GarbageCollectibleStringInterning
{
    private static IDictionary<string,string> strings = new Dictionary<string,string>();

    private static ReaderWriterLockSlim locker = new ReaderWriterLockSlim();
    
    public static void Clear()
    {
        locker.EnterWriteLock();
        try
        {
            strings.Clear();
        }
        finally
        {
            locker.ExitWriteLock();
        }
    }
    
    public static string Intern(string str)
    {
        string val;
        
        locker.EnterReadLock();
        try
        {
            if(strings.TryGetValue(str, out val))
                return val;
        }
        finally
        {
            locker.ExitReadLock();
        }
        
        locker.EnterWriteLock();
        try
        {
            if(strings.TryGetValue(str, out val))
                return val;
                
            strings.Add(str,str);
            return str;
        }
        finally
        {
            locker.ExitWriteLock();
        }
    }
}

This is a fairly simple implementation, a more complex one may try to dynamically respond to GC notification, but I think that this would be useful enough on its own.

Using this approach, I was able to reduce used memory in the profiler by over 50%. I gave up on that approach, however, because while it may reduce the memory footprint, it doesn't actually solve the problem, only delay it.

time to read 2 min | 275 words

So, I have a problem with the profiler. At the root of things, the profiler is managing a bunch of strings (SQL statements, stack traces, alerts, etc). When you start pouring large amount of information into the profiler, the number of strings that it is going to keep in memory is going to increase, until you get to say hello to OutOfMemoryException.
During my attempt to resolve this issue, I figured out that string interning was likely to be the most efficient way to resolve my problem. After all, most of the strings that I have to display are repetitive. String interning has one problem, it exists forever. I spent a few minutes creating a garbage collectible method of doing string interning. In my first test, which was focused on just interning stack traces, I was able to reduce memory consumption by 50% (about 800Mb, post GC) and it is fully garbage collectible, so it won’t hung around forever.

Sounds good, right?

Well, not really. While it is an interesting thought experiment, using interning is a great way of handling things, but it only mask the problem, and that only for a short amount of time. The problem is still an open ended set of data that I need to deal with, and while there are a whole bunch of stuff that I can do to delay the inevitable, defeat is pretty much ensured. The proper way of doing that is not trying to use hacks to reduce memory usage, but to deal with the root cause, keeping everything in memory.

time to read 3 min | 488 words

My last post caused quite a bit of furor, and I decided that I wanted to respond to all the comments in a single place.

  • EF has a designer, NHibernate does not.
    This is actually false, NHibernate has multiple designers available for it. Active Writer (Free, OSS, integrated into VS), Visual NHibernate (Commercial, Beta) and LLBLGen (Commercial, forthcoming in early 2010). I would say that using a designer with NHibernate isn’t something that is very common, most people tend to either code gen the entire model and tweak that (minority) or hand craft the model & mapping. That isn’t for lack of options, it is because it is simply more efficient to do so in most cases.
  • EF is from Microsoft.
    Yes, it is. That is a good point, because it reflect on support & documentation. Unfortunately, the fact that this was one of the most prominent reasons quoted in the replies is also interesting. It says a lot about the relative quality of the products themselves. Another issue with a data access framework from Microsoft is that history teaches us that few data access methods from Microsoft survive the 2 years mark, and none survive the 5 years mark. RDO, ADO, ADO.Net, Object Spaces, Linq To Sql, Entity Framework – just to name a few.
  • Downstream integration.
    That was mentioned a few times, as in integration with data services, WCF RIA, etc. I want to divide my comment to that into two parts. First, everything that exists right now can be use with NHibernate. Second, EF is supposed to come with reporting / BI tools in the future. Currently, everything that came up was easily usable with NHibernate, so I am not really worried about it.
  • In the Future it will be awesome.
    Some people pointed out that Microsoft is able to allocate more resources for EF than an OSS project can. That is true to a point. One of the problems that Microsoft is facing is that it has to pay a huge amount of taxes in the way to create a releasable product. That means that it is typically easier for an OSS project to release faster than a comparable Microsoft project.

So far, I find it really interesting that no one came up with any concrete feature that EF can do that NHibernate can’t. I am going to let you in on a secret, when EF was announced, there were exactly two things that it could do that NHibernate could not. Both were fixed before EF 1.0 shipped, just because that fact annoyed me.

Are you telling me that no such thing exists for the new version?

time to read 2 min | 274 words

The following change took a while to figure out, but it was a huge performance benefit (think, 5 orders of magnitude). The code started as:

private readonly Regex startOfParametersSection = 
            new Regex(@"(;\s*)[@:?]p0 =", RegexOptions.Compiled);

And the optimization is:

private static readonly Regex startOfParametersSection = 
            new Regex(@"(;\s*)[@:?]p0 =", RegexOptions.Compiled);

The story behind this is interesting, this piece of code (and a few others like it) used to be in a class that has a singleton lifestyle. At some point, it was refactored into a command class that is created often, which obviously had… drastic effect on the system performance.

time to read 1 min | 116 words

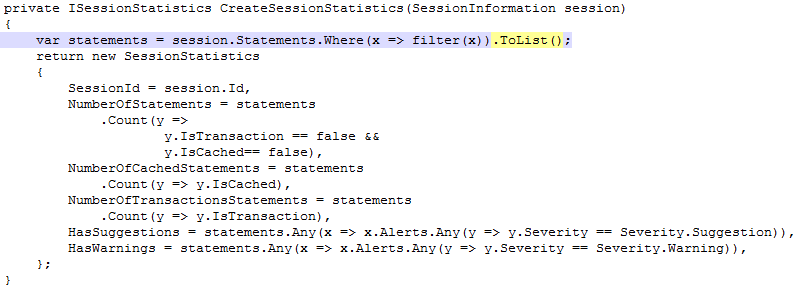
This is a diff from the performance improvement effort of UberProf. The simple addition of .ToList() has significantly improved the performance of this function:

image

Why?

Before adding the ToList(), each time we try to run our aggregation functions on the statements enumerable, we would force re-evaluation of the filtering (which can be quite expensive). By adding ToList() I am now making the filtering run only once.

There is another pretty obvious performance optimization that can be done here, can you see it? And why did I choose not to implement it?

time to read 1 min | 103 words

I am trying to formulate my formal response to “NH vs. EF” question, and while I have a pretty solid draft ready, I found out that my response is pretty biased. I am not happy with that, so I wanted to pose this as a real question.

So far, I came up with:

  • EF 4.0 has a better Linq provider than the current NHibernate implementation. This is something being actively worked on and the NH 3.0 will fix this gap.

My sense of fairness says that this can’t be it, so please educate me.

FUTURE POSTS

  1. Partial writes, IO_Uring and safety - about one day from now
  2. Configuration values & Escape hatches - 5 days from now
  3. What happens when a sparse file allocation fails? - 7 days from now
  4. NTFS has an emergency stash of disk space - 9 days from now
  5. Challenge: Giving file system developer ulcer - 12 days from now

And 4 more posts are pending...

There are posts all the way to Feb 17, 2025

RECENT SERIES

  1. Challenge (77):
    20 Jan 2025 - What does this code do?
  2. Answer (13):
    22 Jan 2025 - What does this code do?
  3. Production post-mortem (2):
    17 Jan 2025 - Inspecting ourselves to death
  4. Performance discovery (2):
    10 Jan 2025 - IOPS vs. IOPS
View all series

Syndication

Main feed Feed Stats
Comments feed   Comments Feed Stats
}