Memory obesity and the curse of the string
I believe that I have mentioned that my major problem with the memory usage in the profiler is with strings. The profiler is doing a lot with strings, queries, stack traces, log messages, etc are all creating quite a lot of strings that the profiler needs to inspect, analyze and finally produce the final output.
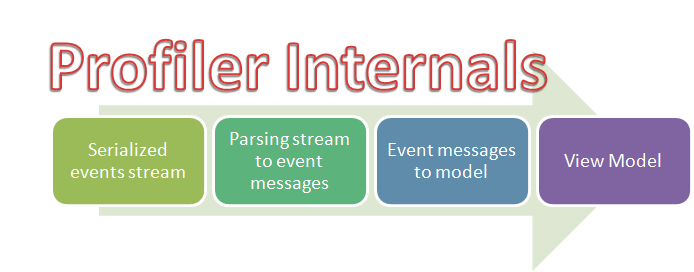
Internally, the process looks like this:

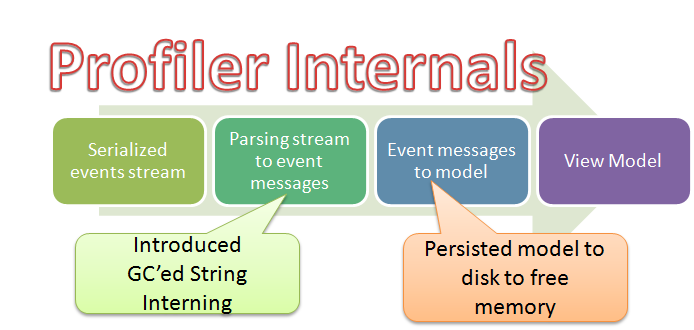
On my previous post, I talked about the two major changes that I made so far to reduce memory usage, you can see them below. I introduced string interning in the parsing stage and serialized the model to disk so we wouldn’t have to keep it all in memory, which resulted in the following structure:
However, while those measures helped tremendously, there is still more that I can do. The major problem with string interning is that you first have to have the string in order to check it in the interned table. That means that while you save on memory in the long run, in the short run, you are still allocating a lot of strings. My next move is to handle interning directly from buffered input, skipping the need to allocate memory for a string to use as the key for interning.
Doing that has been a bit hard, mostly because I had to go deep into the serialization engine that I use (Protocol Buffers) and add that capability. It is also fairly complex to handle something like this without having to allocating a search key in the strings table. But, once I did that, I noticed three things.
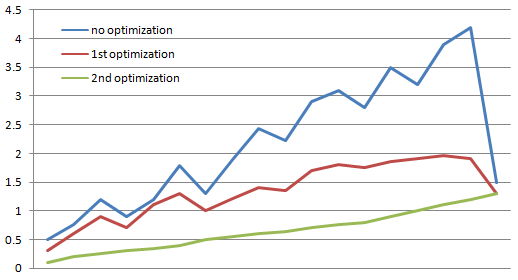
First, while memory increased during operation, there weren’t any jumps & drops, that is, we couldn’t see any periods in which the GC kicked in and released a lot of garbage. Second, memory consumption was relatively low through the operation. Before optimizing the memory usage, we are talking about 4 GB for processing and 1.5 GB for final result, after the previous optimization it was 1.9 GB for processing and 1.3 for final result. But after this optimization, we have a fairly simple upward spike up to 1.3 GB. You can see the memory consumption during processing in the following chart, memory used in in GB on the Y axis.
As you can probably tell, I am much happier with the green line than the other. Not only just because it takes less memory in general, but because it is much more predictable, it means that the application’s behavior is going to be easier to reason about.
But this optimization brings to mind the question, since I just introduced interning at the serialization level, do I really need to have interning at the streaming level? On the face of it, it looks like an unnecessary duplication. Indeed, removing the string interning that we did in the streaming level reduce overall memory usage from 1.3GB to 1.15GB.
Overall, I think this is a nice piece of work.


Comments
The thing that I love about these posts is that it is a real-world example that one can truly start with the simplest thing that could possibly work, then measure the performance and make incremental changes late in the cycle to increase performance once you have solid numbers. Because you have a well-structured app, good unit tests, and a solid understanding of the framework, it's like modeling clay in your hands.
Thanks for posting this!
Out of curiosity, if you were modifying the internals of the Protocol Buffers implementation, are you planning on contributing a patch back to the project (assuming you're using one of te existing ones, not a hand-rolled implementation)? That seems like a pretty big win all around.
Marc,
As I pointed yesterday, I am using one of the OSS implementations, yes.
I contacted the maintainer about this, but this is something of a special case, so I don't know if this will end up there
Is it possible to post some code samples of interning directly from the byte buffers?
Interesting...
Do you have any strategy in place to deal with unique strings being interned, to avoid your memory usage still slowly and inevitably creeping up over time?
Leon,
The table is dynamic, based on LRU.
That means that strings that are unique will eventually fall out of it
Which tool do you use for such beautiful graphics (first two).
PowerPoint.
Comment preview