Oren Eini

CEO of RavenDB

a NoSQL Open Source Document Database

Get in touch with me:

oren@ravendb.net +972 52-548-6969

Posts: 7,520
|
Comments: 51,142
Privacy Policy · Terms
filter by tags archive
time to read 1 min | 190 words

Many people who want to gain the benefits of RavenDB are facing a lot of challenges when they look at their projects. This is especially the case when we are talking about moving existing projects to RavenDB, rather than doing green field development. Recently we have seen quite a bit of a surge in customers coming to us for assistance in that area.

As a result of that, I would like to announce that we are now offering those services as a core part of our offering. If you have an existing application and you want to move all or part of it to RavenDB, we now have completed training for staff to help you do just that. This can be just a standalone

In addition to that, because this is a new service, we are actually going to offer the first three new customers this service for free (contact support@ravendb.net for this).

We want to encourage people to use RavenDB, and I think that one of the key things we can do to help is reduce any barriers to entry, and this one is pretty big.

time to read 1 min | 159 words

One of the things that tend to get lost is the fact that Hibernating Rhinos is doing more than just working on RavenDB. The tagline we like to use is Easier Data, and the main goal we have is to provide users with better ways to access, monitor and manage their data.

We have started planning the next version of the Uber Profiler, that means Entity Framework Profiler, NHibernate Profiler, etc. Obviously, we’ll offer support for EF 7.0 and NHibernate 4.0, and we had gathered quite a big dataset for common errors when using an OR/M, which we intend to convert into useful guidance whenever our users run into such an issue.

But I realized that I was so busy working on RavenDB that I forgot to even mention the work we’ve been doing elsewhere. And I also wanted to solicit feedback about the kind of features you’ll want to see in the 3.0 version of the profilers.

time to read 2 min | 256 words

I’m pretty bad when it comes to actually organizing my blog. I just like to write stuff out, I don’t like to do things like properly setting things up in series. Mostly because I usually think about one post at a time, or three at the most.

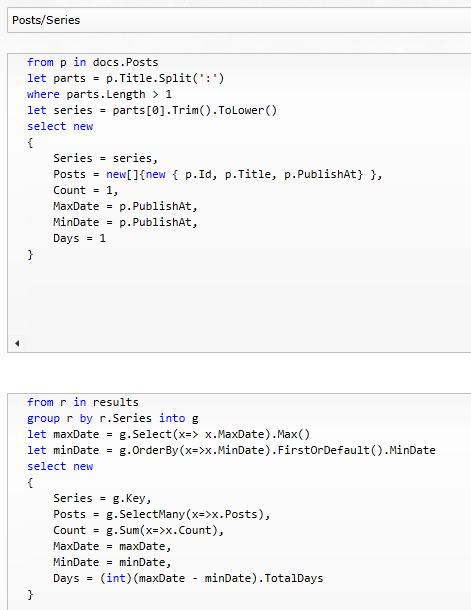
I did notice that I usually use something like “Series name: post name” convention when writing series of posts. So I decided to write the following index to check the data out:

image

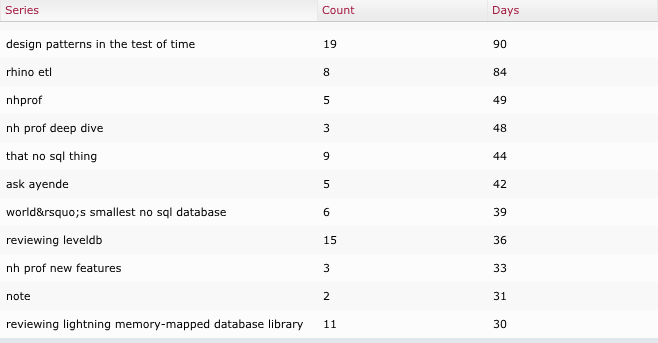
As you can see, this is pretty simple way of doing things. And that lead to the following data.

image

Some of those are obviously false positives, and we have things like this, which are obviously out:

image

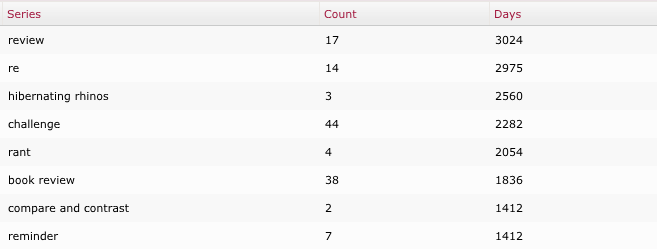
But it looks like important series are also spread over time:

image

I think that I’m going to have to do a new blog feature, to highlight those emergent series.

time to read 2 min | 391 words

One of the things that we have to deal with as a replicated database is how to handle failure. In RavenDB, we have dealt with that with replication, automatic failover and a smart backoff strategy that combined reducing the impact on the clients when a node was down with being able to detect that it was up quickly.

In RavenDB 3.0, we have improved on that. Before, we would ping the failed server every now and then, to check if it is up. However, that would mean that routine operations would slow down, even when the failover server was working. In order to handle this, we used to have a backoff strategy for checking the failed server. We would only check it once every 10th request, until we have 10 failed requests, then we would check it only once every 100th request, until we had a 100 failed requests, etc. That worked quite well. Mostly because a lot of the time, failures are transients, and you don’t want to fail to a secondary for too long, and if we had a long standing issue, we had a small hiccup, and then everything worked fine, with the occasional hold on a request while we checked things. In addition to that, we also have gossip mechanism that would inform clients that their server is up so they can figure out that the primary server is up even faster.

Anyway, that is what we used to do. In RavenDB 3.0, we have moved to using an async pinging approach. When we detect that the server is down, we will still do the checks as before, but unlike 2.x, we won’t do them in the current execution thread, instead, we have a background task that will ping the server to see if it is up. That means that after the first failed request, we will immediately switch over to the secondary, and we will keep on the secondary until the background ping process will report that everything is up.

That means that for a very short failure (less than 1 second, usually) we will switch over to the secondary, where before we’ll be able to figure out that the server is still up. But the upside here is that we won’t have any interruption in service just to check that the primary is up.

Voron & Graphs

time to read 4 min | 660 words

One of our guys is having fun playing with graph databases, and we had a serious discussion on how we can use Voron for that.

No, we don’t have any plans to do a graph database. This is purely one of the guys playing with something that interest him.

For the purpose of this post, I’m only concerned with having the ability to store graph data and read them efficiently. I don’t care for the actual graph operations.

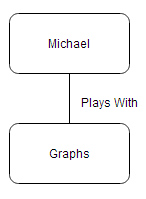
Let us look at the following graph:

image

Here is how we can define this in code:

var michael = db.CreateNode();
michael["Name"] = "Michael";

var graphs = db.CreateNode();
graphs["Name"] = "Graphs";

var edge = michael.RelatesTo(graphs, db.Relationship("Plays With"));

Now, how would we go about implementing something like this? Well, with Voron, that is pretty easy.

We’ll start with defining a Nodes tree, which is going to using an incremental 64 bits integer for the key, and a JSON object for the value. This means that on CreateNode, we’ll just allocate the id for it, and just have the node itself as a JSON object that can be as complex as you want.

We also have relationships, and here it gets a bit complex, a relationship is always from a node to a node, and it has a specific type. Because the types of relationships tend to be very few, we will limit them to 65,536 relationship types. I think that this would be more than enough. As a result, I can quickly get the id of a relationship type. This leads us to having another tree in Voron, the RelationshipTypes tree, with a key that is the string name of the relationship and the value is just an incremental short. The reason we need to do this will be obvious shortly.

After we have the relationship type, we need to record the actual relationships. That means that we need to consider how we want to record that. Relationships can have their own properties, so the actual relationship is going to be another JSON object as the value in a tree. But what about the key for this tree? The question here is how are we going to work with this? What sort of queries are we going to issue. Obviously, in a graph database, we are going to follow relationships a lot. And the kind of questions we are going to ask are almost always going to be “from node X, find all outgoing relations of type Y”. So we might as well do this properly.

The key for the relations tree would be 18 bytes, the first 8 bytes are the source node id, the next 2 bytes are the relationship type and the last 8 bytes are the destination node id. That means that on the disk, the data is actually sorted first by the node id, then by the relationship type. Which make the kind of queries that I was talking about very natural and fast.

And that is pretty much it. Oh, you’re going to need metadata tree for things like the last relationship type id, and probably other stuff. But that is it, when speaking from the point of view of the storage.

The overall structure is:

Nodes - (Key: Int64, Val: JSON)

RelationshipTypes – (Key: string, Val: Int16)

Relationships ( Key: Int64, Int16, Int64, Val: JSON)

And on top of that you’ll be able to write any sort of graph logic.

time to read 1 min | 179 words

One of the results of expanding the RavenDB’s team is that we have to deal with a lot more pull requests. We have individual developers working on their features, and submitting pull requests on a daily basis. That usually means that I have to merge anything between ten to thirty pull requests per day.

Given our test suite runtime, it isn’t really reasonable to run the full test suite after each pull request, so we merge them all, review them, and then run the tests. The problem then is that if there was a test failure… which pull request, and which commit cause it?

That is why git has the wonderful git bisect command. And we have taken advantage of that to enable the following development time feature:

./bisect.ps1 HEAD HEAD~10 General_Initialized_WithoutErrors

It will output something like:

631caa60719b1a65891eec37c4ccb4673eb28d02 is the first bad commit
commit 631caa60719b1a65891eec37c4ccb4673eb28d02
Author: Pawel Pekrol
Date: Fri May 9 08:57:55 2014 +0200
another temp commit

Pin pointing exactly where the issue is.

And yes, this is here as a post primarily because I might forget about it.

time to read 2 min | 360 words

We had an interesting issue at a customer recently, and it took a while to resolve, so it is interesting. The underlying problem as stated by the customer was that they tried to reset an index, and RavenDB took all the memory on the machine. That is kinda rude, and we have taken steps to ensure that this wouldn’t happen, so that was surprising.

So we settled down to figure out what was going on, and we were able to reproduce this locally. That was strange, and quite annoying. We finally narrowed things down to very large documents. There was a collection on this database where most documents were several MB in size. We do a lot of rate limiting, to avoid overloading, but we do usually do that on the count of documents, not the size of them. Except, that we actually do limit the size where it matter.

When we load documents to be indexed, we specify a maximum size (usually 128MB) per batch. However… what actually happens is that we go to the storage and ask it, give us X amount of documents, up to Y amount in size. The question is, what size. And in this case, we are using the size on disk, which has a close correlation to the actual size taken when loading into a JSON object. Except… when we use compression.

When we have compression, what actually happens is that we limited to the maximum size of the compressed data, which can be 10% – 15% of the actual data size when we decompress it in memory. That was a large part of the problem. Another issue was what happened when we had prefetching enabled. We routinely prefetch data to memory so we won’t have to wait for I/O. The prefetcher only considered documents count, but when each document is multiple MB, we really needed to consider both count and size.

Both issues were fixed, and there are no longer any issues with this dataset. Interestingly enough, the customer had no issue when creating the database, because it only had to deal with whatever changed, and not the entire data set.

time to read 2 min | 233 words

I really like the TPL, and I really like the async/await syntax. It is drastically better than any other attempt I’ve seen to handle concurrency.

But it also has a really major issue. There is no way to properly debug things. Imagine that I have the following code:

public Task DoSomething()
{
return new TaskCompletionSource<object>().Task;
}

And now imagine that I have some code that is going to do an await DoSomething();

What is going to happen? This is a never ending task, so we’ll never return. And that is fine, except that there is absolutely no way to see that. I have no way of seeing which task didn’t return, and I have no way of seeing all the pending tasks, and what they are all waiting for, etc. I’ve run into something like that (obviously a lot harder to figure out) too many times.

If I was using non async code, it would be obvious that there is this thread that is stopped on this thing, and I could figure it out. For us, this make it a lot harder to work with.

time to read 9 min | 1700 words

Afif asked me a very interesting question:

image

And then followed up with a list of detailed questions. I couldn’t be happier. Well, maybe if I found this place, but until then…

First question:

I am curious about how much Lucene concepts does one need to be aware of to grasp the RavenDB code base? For e.g. will not knowing Lucene concept X limit you from understanding module Y, or is the concept X interviewed in such a manner that you simply won't get why the code is doing what its doing in dribs and drabs over many places.

In theory, you don’t need to know any Lucene to make use of RavenDB. We do a pretty good job of hiding it when you are using the client API. And we have a lot of code (tens of thousands of lines, easy) dedicated to making sure that you needn’t be aware of that. The Linq query providers, in particular, do a lot of that work. You can just think in C#, and we’ll take care of everything.

In practice, however, you need to know some concepts if you want to be able to really make full use of RavenDB. Probably the most important and visible concept is the notion of the transformations we do from the index output to the Lucene entries, and the impact of analyzers on that. This is important for complex searching, full text search, etc. A lot of that is happening in the AnonymousObjectToLuceneDocumentConverter class, and then you have the Lucene Analyzers, which allow to do full text searches. The Lucene query syntax is also good to know, because this is how we are actually processing queries. And understanding how the actual queries work can be helpful as well. But usually that isn’t required.

Some advanced features (Suggestions, More Like This, Facets, Dynamic Aggregation) are built on top of Lucene features directly, and understanding how they work is helpful, but not mandatory to making real use of them.

Second question:

Oren has often referred to RavenDB as an ACID store on top of which is an eventually consistent indexing store built. Is this a mere conceptual separation or is it clearly manifested in code? If so, how tight is the coupling, can you understand and learn one without caring much about the other?

Yes, there is a quite clear separation in the code between the two. We have ITransactionalStorage which is how the ACID store is accessed. Note that we use the concept of a wrapper method, Batch(Action<IStorageActionsAccessor>) to actually handle transactions. In general, the DocumentDatabase class is responsible for coordinating a lot of that work, but it isn’t actually doing most of it. Indexing are handled by the IndexStorage, which is mostly about maintaining the Lucene indexes properly. Then you have the IndexingExecuter, which is responsible for actually indexing all the documents. The eventual consistency aspect of RavenDB comes into play because we aren’t processing the indexes in the same transaction as the writes, we are doing that in a background thread.

In general, anything that comes from the transactional store is ACID, and anything that comes from the indexes is BASE.

Third question:

Often operational concerns add a lot of complexity (think disaster recovery, optimizations for low end machines). When looking at feature code, will I know constructs a,b,c are intermingled here to satisfy operational feature y, so I can easily separate the wheat from the chaff.

Wow, that is really hard to answer.  It is also one of our recurring pain points. Because .NET is a managed language, it is much harder to manage some things with it. I would love to be able to just tell the indexing to use this size limited heap, instead of having to worry about it using too much memory. Because of that, we’re often having to do second order stuff and guesstimate.

A lot of the code for that is in auto tuners, like this one. And we have a lot of code in the indexing related to handling that. For example, catching an OutOfMemoryException and trying to handle that.  Disaster recover is mostly handled by the transactional storage, but we do have a lot of stuff that is meant to help us with indexing. Commit points in indexes is a case where we try to be prepared for crashing, and store enough information to recover more quickly. At startup we also do checks for all indexes, to make sure that they aren’t corrupted.

A lot of other stuff is already there an exposed, the page size limits, the number of requests per session, etc. We also have a lot of configuration options that allow the users on low end machines to instruct us how to behave, but we usually want to have that handled automatically. You can also see us taking into account size & count for documents when loading them. Usually we try to move them out of the mainline code, but we can’t always do so. But it is hard for me to point at a feature code and say, this is there to support operational concern X.

That said, metrics is operational concern, an important one, and you can see how we use that throughout the code, by trying to measure how certain things are going, we get a major benefit down the road when we need to figure out what is actually going on. Another aspect of operational concern is the debug endpoints, which expose a lot of information about RavenDB internal behavior. This is also the case for debugging how an index is built, for which we have a dedicated endpoint as well.

In the replication code, you can see a lot of error handling, since we expect and handle the other side to be down a lot. A lot of thought an experience has gone into the replication, and you can see a lot of that there. The notion of batches, back off strategies, startup notifications, etc.

One thing you’ll notice that match your question is that we have a lot of stuff like this:

using (LogManager.OpenMappedContext("database", Name ?? Constants.SystemDatabase))

This is there to provide us with context for the logs, and it is usually required when we do things in the background.

Fourth question:

Is there a consistent approach to handle side effects, for e.g when x is saved, update y. Pub/sub, task queue, something else? I am hoping if I am made aware of these patterns I will more easily be able to discover/decipher such interactions.

Yes, there is! It is an interesting one, too. The way it works, every transaction has a way of saying that it did something that other pieces of RavenDB that something happened. This is done via the WorkContext’s method ShouldNotifyAboutWork, which will eventually raise the work notification when the transaction is completed. The other side there is the waiting for work, obviously.

That means that a lot of the code in RavenDB is actually sitting in a loop, like so:

while (context.DoWork)
{
    DoWork();
    var isIdle = context.WaitForWork();
    if(context.DoWork == false)
        break;
    if(idIdle)
        DoIdleWork();
}

There are variants, obviously, but this is how we handle everything, from indexing to replication.

Note that we don’t bother to distinguish between work types. Work can be a new document, a deleted index or indexing completing a run. Either one of those would generate a work notification. There is some code there to optimize for the case where we have a lot of work, and we won’t take a lock if we can avoid it, but the concept is pretty simple.

Fifth question:

Should I expect to see a lot of threading/synchronization code for fulfilling multi core processing concerns, or true to .NET's more recent promises, are these concerns mostly addressed by good usage of Tasks, async await, reactive extensions etc.

Well, this is a tough one. In general, I want to answer no, we don’t. But it is a complex answer. Client side, ever since 3.0, we are pretty much all async. All our API calls are purely running via the async stuff. We have support for reactive extensions, in the sense of our Changes() API, but we don’t make any use of it internally. Server side, we have very little real async code, mostly because we found that it made it very hard to debug the system under certain conditions. Instead, we do a lot of producer consumer kind of stuff (see transaction merging) and we try to avoid doing any explicit multi threading. That said, however, we do have a lot of work done in parallel. Indexing, both per index and inside each index. A lot of that work is done through our own parallel primitives, because we need to be aware of what is actually going on in the system.

We have some places where we have to be aware of multi threaded concerns, sometimes in a very funny ways (how we structure the on disk data to avoid concurrency issues) and sometimes explicitly (see how we handle transport state).

For the most part, we tend to have a dedicated manager thread per task, such as replication, indexing, etc. Then that actual work is done in parallel (for each index, destination, etc).

I hope that this give you some guidance, and I’ll be very happy to answer any additional questions, either from Afif or from anyone else.

time to read 1 min | 122 words

I’m going to be talking in that 2014 NService Bus Conference. More specifically, I’m going to be talking about how to build proper distributed systems with RavenDB. What sort of things you need to watch out for, what features in RavenDB you can take advantage of and general distributed data design.

But there is more going on with RavenDB in NServiceBus. A lot of the new features in the Particular Service Platform are built based on RavenDB, and you’ll have the chance to hear all about it there.


nsbcon14-300-px-x-300-px

FUTURE POSTS

No future posts left, oh my!

RECENT SERIES

  1. Challenge (75):
    01 Jul 2024 - Efficient snapshotable state
  2. Recording (14):
    19 Jun 2024 - Building a Database Engine in C# & .NET
  3. re (33):
    28 May 2024 - Secure Drop protocol
  4. Meta Blog (2):
    23 Jan 2024 - I'm a JS Developer now
  5. Production Postmortem (51):
    12 Dec 2023 - The Spawn of Denial of Service
View all series

Syndication

Main feed Feed Stats
Comments feed   Comments Feed Stats
}