Oren Eini

CEO of RavenDB

a NoSQL Open Source Document Database

Get in touch with me:

oren@ravendb.net +972 52-548-6969

Posts: 7,546
|
Comments: 51,161
Privacy Policy · Terms
filter by tags archive
time to read 4 min | 629 words

PageTable is a pretty critical piece of Voron. It is the component responsible for remapping modified pages in transactions and is the reason why we support MVCC and can avoid taking locks for the most part. It has been an incredibly stable part of our software, rarely changing and pretty much the same as it was when it was initially written in 2013. It has been the subject for multiple performance reviews in that time, but acceptable levels of performance from our code in 2013 is no longer acceptable today. PageTable came up recently in one of our performance reviews as a problematic component. It was responsible for too much CPU and far too many allocations.

Here is a drastically simplified implementation, which retain the salient points:

Here is the sample workout for this class, which just simulates ten thousand transactions. This little scenario takes 15.3 seconds and allocates a total of 1.1GB of memory! That is a lot of allocations, and must have tremendous amount of time spent in GC. The most problematic issue here is the SetItems methods, which will allocate two different delegates for each modified page in the transaction. Then we have the total abandon in which we’ll allocate additional memory in there. As you can imagine, we weren’t very happy about this, so we set out to fix this issue.

We can take advantage off the fact that SetItems and RemoveBefore are only called under lock, while TryGetValue is called concurrently with everything else.

So I wrote the following code:

This relies on allowing stale reads from concurrent readers, which we don’t care about since they wouldn’t be able to make use of the data anyway, and it was able to reduce the allocations to just 320 MB, but the runtime actually went up to 32 seconds.

That is quite annoying, as you can imagine, and much cursing enthused as a result. I then pulled my trusty profiler ask it kindly to figure out what piece of code needs to be hit with a rolling pin and have a stern talk to about what is expected from code after it has been laboriously and carefully optimized. It is expected to sit nicely and be fast, or by Git I’ll revert you.

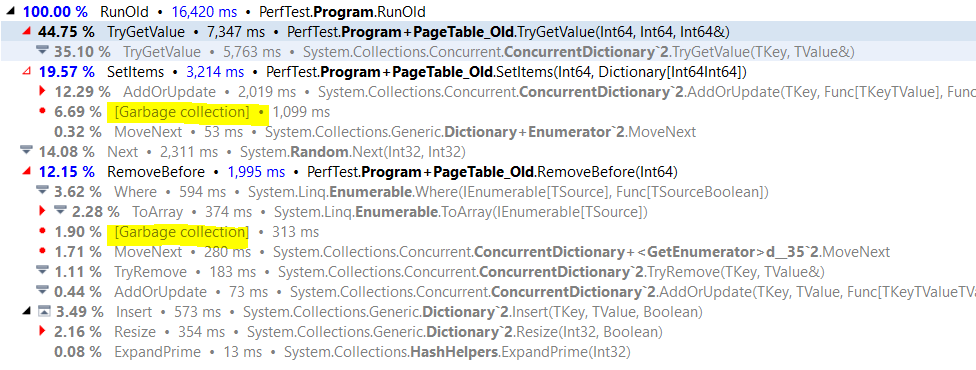
What the hell?! Here are the original implementation costs, and you can clearly see how much time we are spending on garbage collection.

image

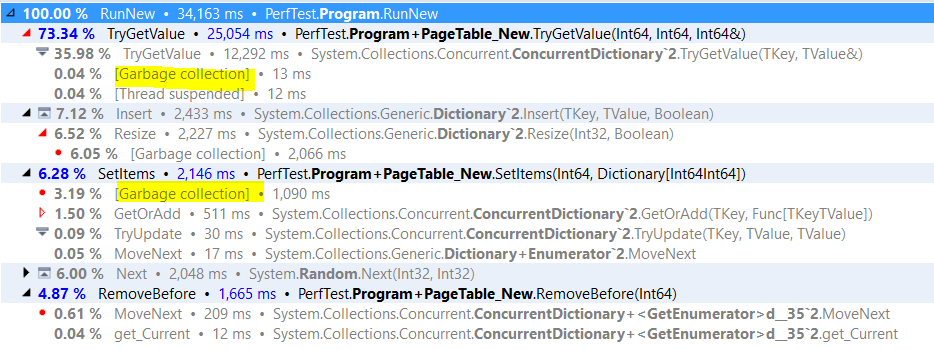
And here is the optimized version, which is actually slower, and actually used more memory?!

image

There are a bunch of interesting things going on here. We can see that we are indeed using spending a little less time in GC, and that both RemoveBefore and SetItems methods are much cheaper, but the cost of TryGetValue is so much higher, in fact, if we compare the two, we have:

image

So we are 3.4 times higher, and somehow, the cost of calling the concurrent dictionary TryGetValue has risen by 88%.

But the implementation is pretty much the same, and there isn’t anything else that looks like it can cause that much of a performance gap.

I’ll leave this riddle for now, because it drove me crazy for two whole days and give you the details on what is going on in the next post.

time to read 2 min | 343 words

I have to go over a fairly compress pull request, adding a pretty big feature. The feature, if you care, is compressing data in the leaf pages of a B+Tree for use in Map/Reduce entries storage. The current and non final results are reducing storage costs from about 650MB to 32MB, so we are pretty happy with it, but this isn’t the topic of this post.

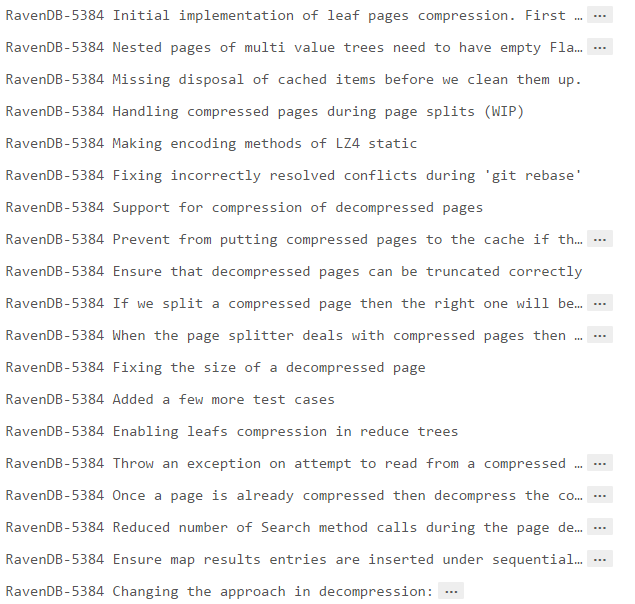
At this stage, the feature is not complete, but it is ready for initial review, so we created a temporary PR to review it, here is a partial view:

image

There are over 30 commits over a period of three weeks there, and they represent a lot of experimentation as we go along. This is fine & proper as far as we are concerned, since we this represent quite a bit of work, and we certainly want to be able to track it. But since this isn’t completed, the commit history is long, which means that reviewing it one commit at a time is not trivial. In particular, there are a lot of back and forth changes in the same place, and I don’t want to review code that has been changed.

Luckily, git make it easy to change that view.

I pull the changes to my local branch, then reset the log to the last commit before the merge, then I just squashed all those commit into a single one. You can check it out here.

The final result is:

image

Which is much nicer way to go about reviewing this, since I can look at all the changes in one shot, and more to the point, I can make comments on the changes using our normal workflow.

time to read 2 min | 372 words

Note: This post was written by Federico.

Recently at CoreFX there has been a proposal to deal with the typical case of everyone writing their own hash combining logic. I really like the framework to push that kind of functionality because hashing is one of those things that unless you really know what you are doing, it can backfire pretty bad (and even if you know, you can step over the cliff too).  But this post is not about the issue itself, but it showcases a few little details that happen at JIT land (and that we usually abuse, of course J). This is the issue: https://github.com/dotnet/corefx/issues/8034#issuecomment-260733285

Let me illustrate with some examples.
ValueTuple is a new type that is being introduced that is necessary for some of the new tuples functionality in C# 7. Because hashing is important, of course they implemented the ability to combine hashes. Now, let’s suppose that we take the actual code hashing code that is being used for ValueTuple and use constants to call it. 

Now under an optimizing compiler chances are that there shouldn't be any difference, but in reality there is.

This is the actual machine code for ValueTuple:

So now what can be seen here? First we are creating an struct in the stack, then we are calling the actual hash code.

Now compare it with the use of HashHelper.Combine which for all purposes it could be the actual implementation of Hash.Combine

I know!!! How cool is that???
But let’s not stop there... let’s use actual parameters:

We use random values here to force the JIT to treat them as parameters and not being able to eliminate the code and convert it yet again into a constant.

The good thing, this is extremely stable. But let’s compare it with the alternative:

The question that you may be asking yourselves is: Does that scale?. So, let’s go overboard...

And the result is pretty illustrative:

The takeaway of the analysis is simple: even if the holding type is a struct, it doesn't mean it is free :)

time to read 2 min | 339 words

I really wanted to leave this series of posts alone. Getting 135 times faster should be fast enough for everyone, just like 640KB was.

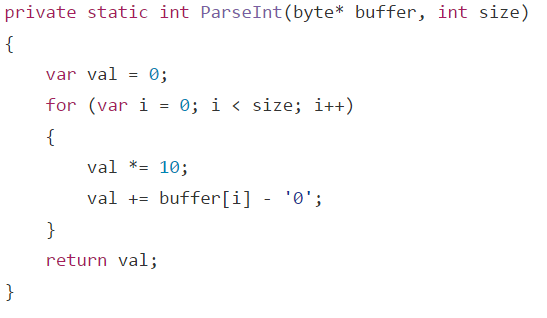
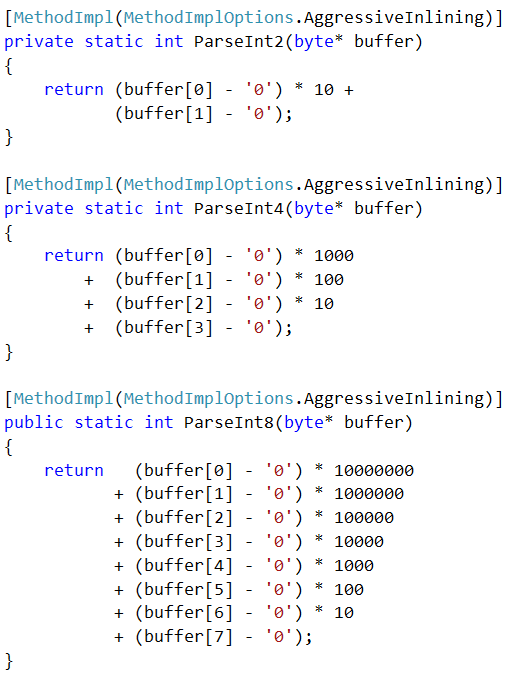
Unfortunately, performance optimization is addictive. Last time, we left it at 283 ms per run. But we still left some performance on the table. I mean, we had inefficient code like this:

image

Just look at it. Analysis showed that it is always called with 2, 4 or 8 only. So we naturally simplified things:

image

Forcing the inlining of those methods also helped, and pushed us further toward 240 ms.

Another cost that we had was date diff calculation, we optimized for the case where the day is the same, but in our dataset, we have about 2 million records that cross the day line. So we further optimized for the scenario where the year & month are the same, and just the day is different. That pushed us further toward 220 ms.

At this point the profiler was basically laughing at us, and we had no real avenues to move forward, so I made the code use 4 threads, each processing the file at different locations.

That gave me: 73 ms and allocated 5,640 kb with peak working set of 300,580 kb

  • 527 times faster than the original version.
  • Allocate 1350 times less memory.
  • 1/3 of the working set.
  • Able to process 3.7 GB / sec.

Note that at this point, we are relying on this being in the file system cache, because if I was reading it from disk, I wouldn’t be able to do more than 100 – 200 MB / sec.

Here is the full code, write code like this at your peril.

time to read 3 min | 403 words

Okay, at this point we are really pushing it, but I do wonder if we can get it faster still?

image

So we spend a lot of time in the ParseTime call, parsing two dates and then subtracting them. I wonder if we really need to do that?

I wrote two optimizations, once to compare only the time part if they are the same, and the second to do the date compare in seconds, instead of ticks. Here is what this looks like:

Note that we compare the first 12 bytes using just 2 instructions (by comparing long & int values), since we don’t care what they are, only that they are equal. The result:

283 ms and allocated 1,296 kb with peak working set of 295,200 kb

So we are now 135 times faster than the original version.

Here is the profiler output:

image

And at this point, I think that we are pretty much completely done. We can parse a line in under 75 nanoseconds, and we can process about 1 GB a second on this machine ( my year old plus laptop ).

We can see that the skipping the date compare for time compare if we can pay off in about 65% of the cases, so that is probably a nice boost right there. But I really can’t think of anything else that we can do here that can improve matters in any meaningful way.

For comparison purposes.

Original version:

  • 38,478 ms
  • 7,612,741 kb allocated
  • 874,660 kb peak working set
  • 50 lines of code
  • Extremely readable
  • Easy to change

Final version:

  • 283 ms
  • 1,296 kb allocated
  • 295,200 kb peak working set
  • 180 lines of code
  • Highly specific and require specialize knowledge
  • Hard to change

So yes, that is 135 times faster, but the first version took about 10 minutes to write, then another half an hour to fiddle with it to make it non obviously inefficient. The final version took several days of careful though, analysis of the data and careful optimizations.

time to read 2 min | 343 words

It is a fact of life, if you are looking at a high performance code, a dictionary is probably going to be one of those things that will be painful. Let us see how this look like in our current program:

image

Are you kidding me?! Here I am worrying about every little bit and byte to try to get the most performance out of the system, and Dictionary is eating almost 50% of my performance?

Let us look more deeply into this:

image

So that is about 3 μs, which is pretty fast. But it isn’t fast enough.

Now, know that there are about 200,000 unique values in the dictionary (look at the Insert calls in the profiler output), and we have some knowledge about the problem space.

The id that we use has 8 characters, so at most, we can have a hundred million ids. An array of that size would be roughly 762 MB in size, so that is doable. But we also can be fairly certain that the ids are generated in some sequential manner, so there is a strong likelihood that we don’t need all of this space.

So I wrote the following function:

Changed the stats to start with an array of 256 longs, and run it, the results are nice.

587 ms and allocated 2,576 kb with peak working set of 296,484 kb

And our costs look like:

image

This is single threaded, of course, and it is faster than all the previous multi threaded versions we had before.

time to read 3 min | 456 words

After looking at the profiler results, I realized that we are actually spending a considerable amount of time just writing the output to a file. That didn’t really matter when our code run in 30+ seconds, spending another 100 – 200 ms to write the results was just noise, but when our code is doing that in under a second, that a considerable cost.

I’m running this code on a different machine, so we can’t directly compare. The performance of the initial version is:

38,478 ms and allocated 7,612,741 kb with peak working set of 874,660 kb

And the speed of the latest version is:

842 ms and allocated 208,435 kb with peak working set of 375,452 kb

So we are 45 times faster than the initial version.

The problem is that doing this in parallel takes quite a lot and mask some inefficiencies, so I decided to change it back to using a single threaded approach. Which gives:

1,498 ms and allocated 123,787 kb with peak working set of 319,436 kb

Merely 25 times faster than the original version.

And now let us focus on the output.

This is pretty simple code, but it hides a lot of inefficiencies, in particular, it is doing a lot of allocations as it format the string. We can do much better.

Merely changing the WriteLine to:

output.WriteLine($"{entry.Value.Id} {entry.Value.DurationInTicks}");

Saved us close to 200 ms (!), so there is a lot of space to improve here. Again, this is mostly an issue of creating highly specific code to solve this exact scenario. Here is what I did:

I wrote a simple function to format the number into a buffer, then change the summary line to write a single line into a prepared buffer (and skip all the static stuff), and write the to the file file in one shot.

And the results are:

1,191 ms and allocated 16,942 kb with peak working set of 311,432 kb

You might have noticed that I have two copies of the WriteFormattedInt, this is to skip the implicit cast to long, and yes, it matters, by about 50 ms in my tests. But this version also reduces the number of allocations we have by over 100 MB! So this is great.

And here are the profiler results on analyzing this method:

image

This function is now almost 7 times faster! That is pretty awesome, and even talking about single threaded performance, we are looking at 32 times better than the original version.

Trying the parallel version give me:

731 ms and allocated 101,565 kb with peak working set of 381,224 kb

And a total improvement of 52 times! But we can do even more… I’ll talk about it in the next post.

time to read 2 min | 377 words

After doing all I can without reaching out to the profiler, and managing to get x45 performance gain, let us see what the profiler actually tells us. We’ll use the single threaded version, since that is easier.

Here it is:

image

We can see that dictionary operations take a lot of time, which is to be expected. But what is very surprising is that the date time calls are extremely expensive in this case.

The relevant code for those is here. You can see that it is pretty nice, but there are a bunch of things there that are likely costing us. The exception inside the method prevents in lining, there is error handling here that we don’t need, since we can safely assume in this exercise that the data is valid, etc.

So I changed the ParseTime to do this directly, like so:

And that saved us 11%, just this tiny change.

Here are our current costs:

image

Note that we reduced the cost of parse significantly ( at the cost of error handling, though ), but there are still a lot of work being done here. It turns out that we were actually measuring the time to write to the summary file as well (that is what all those FormatHelpers calls are), so that dirty the results somewhat, but nevermind.

The next place that we need to look at is the Dictionary, it is expensive, even though the usage of FastRecord means that we only need a single call per line, that isn’t so much fun. Note that it is using the GenericEqualityComparer, can we do better?

Trying to create my own equality comparer for longs doesn't really help.

image

So we’ll go back to the parallel version with the ParseTime optimization, and we are now running at 628 ms. And at this rate, I don’t think that there is a lot  more room for improvements, so unless someone suggests something, we are done.

time to read 2 min | 293 words

After introducing the problem and doing some very obvious things, then doing some pretty non obvious things and even writing our own I/O routines we ended up with an implementation that is 17 times faster than the original one.

And yet we can still do better. But at this point, we need to go native and use a bit of unsafe code. We’ll start by implementing a naïve native record parser, like so:

This is pretty much the same as before, but now we are dealing with pointers. How do we use this?

We memory map the file, and then we go over it, doing no allocations at all throughout.

This give us 1 second to process the file, 126 MB allocated (probably in the dictionary) and a peak working set of 320 MB.

We are now 30 times faster than the initial implementation, and I wonder if I can do more… ? We can do that by going parallel, which give us the following code:

This is pretty ugly, but basically we are using 4 threads to run it, and we are giving each one of them a range of the file, as well as their own dedicated records dictionary. After we are done, we need to merge the records to a single dictionary, and that is it.

Using this approach, we can get down to 663 ms run time, 184 MB of allocations and 364 MB peak working set.

So we are now about 45(!) times faster than the original version. We are almost done, but on my next post, I’m going to go ahead and pull the profiler and see if we can squeeze anything else out of it.

FUTURE POSTS

  1. Partial writes, IO_Uring and safety - about one day from now
  2. Configuration values & Escape hatches - 5 days from now
  3. What happens when a sparse file allocation fails? - 7 days from now
  4. NTFS has an emergency stash of disk space - 9 days from now
  5. Challenge: Giving file system developer ulcer - 12 days from now

And 4 more posts are pending...

There are posts all the way to Feb 17, 2025

RECENT SERIES

  1. Challenge (77):
    20 Jan 2025 - What does this code do?
  2. Answer (13):
    22 Jan 2025 - What does this code do?
  3. Production post-mortem (2):
    17 Jan 2025 - Inspecting ourselves to death
  4. Performance discovery (2):
    10 Jan 2025 - IOPS vs. IOPS
View all series

Syndication

Main feed Feed Stats
Comments feed   Comments Feed Stats
}