The performance regression in the optimizationPart I
PageTable is a pretty critical piece of Voron. It is the component responsible for remapping modified pages in transactions and is the reason why we support MVCC and can avoid taking locks for the most part. It has been an incredibly stable part of our software, rarely changing and pretty much the same as it was when it was initially written in 2013. It has been the subject for multiple performance reviews in that time, but acceptable levels of performance from our code in 2013 is no longer acceptable today. PageTable came up recently in one of our performance reviews as a problematic component. It was responsible for too much CPU and far too many allocations.
Here is a drastically simplified implementation, which retain the salient points:
Here is the sample workout for this class, which just simulates ten thousand transactions. This little scenario takes 15.3 seconds and allocates a total of 1.1GB of memory! That is a lot of allocations, and must have tremendous amount of time spent in GC. The most problematic issue here is the SetItems methods, which will allocate two different delegates for each modified page in the transaction. Then we have the total abandon in which we’ll allocate additional memory in there. As you can imagine, we weren’t very happy about this, so we set out to fix this issue.
We can take advantage off the fact that SetItems and RemoveBefore are only called under lock, while TryGetValue is called concurrently with everything else.
So I wrote the following code:
This relies on allowing stale reads from concurrent readers, which we don’t care about since they wouldn’t be able to make use of the data anyway, and it was able to reduce the allocations to just 320 MB, but the runtime actually went up to 32 seconds.
That is quite annoying, as you can imagine, and much cursing enthused as a result. I then pulled my trusty profiler ask it kindly to figure out what piece of code needs to be hit with a rolling pin and have a stern talk to about what is expected from code after it has been laboriously and carefully optimized. It is expected to sit nicely and be fast, or by Git I’ll revert you.
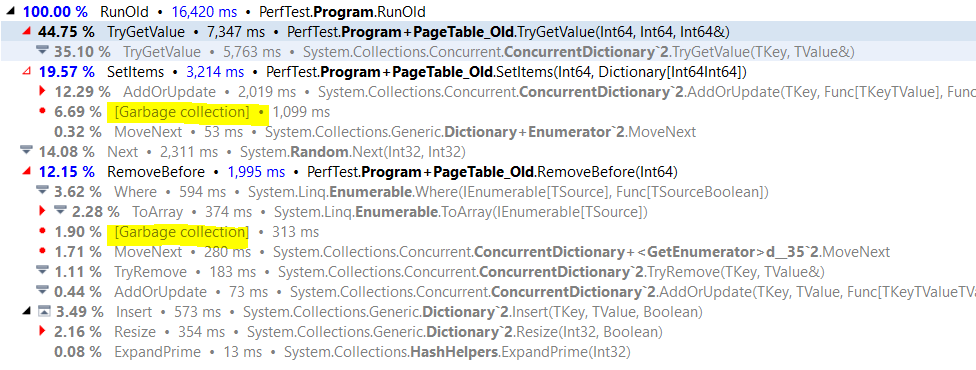
What the hell?! Here are the original implementation costs, and you can clearly see how much time we are spending on garbage collection.
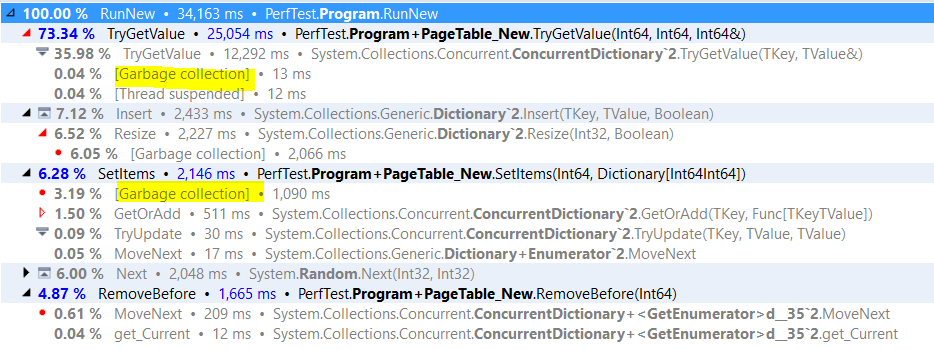
And here is the optimized version, which is actually slower, and actually used more memory?!
There are a bunch of interesting things going on here. We can see that we are indeed using spending a little less time in GC, and that both RemoveBefore and SetItems methods are much cheaper, but the cost of TryGetValue is so much higher, in fact, if we compare the two, we have:
So we are 3.4 times higher, and somehow, the cost of calling the concurrent dictionary TryGetValue has risen by 88%.
But the implementation is pretty much the same, and there isn’t anything else that looks like it can cause that much of a performance gap.
I’ll leave this riddle for now, because it drove me crazy for two whole days and give you the details on what is going on in the next post.


Comments
What could explain slowdown in
PageTableNew.TryGetValue(...)method: before you were doing afor(...)on an array of struct, which would be optimized by the JIT (ABCREM, pointers to current item hoisted in register, maybe unrolling?). But in the new version, bothBufferHolderandTransactionPageare classes, so all access tovalue.End,value.Begin,value.Buffer[...], as well as property access to the fields ofTransactionPageare probably slower because the JIT cannot optimize the code as well (memory indirection, no ABCREM, need to re-read all the properties on each loop iteration, cannot hoist them into registers as much, probably no unrolling possible, ...).Maybe caching all the "constant" fields (Begin, End, Buffer) into local variables could help reduce the overhead?
As for why
ConcurrentDictionary<..>.TryGetValue(...)is slower, I have no idea :) Perhaps there is now more contentions in the dictionary because timings have changed and multiple threads are now bashing the dictionary at the same time?Christophe,
Note that this is a single threaded piece of code :-)
Ok, here is an idea: in old behavior, you add but also remove entries from the mapping dictionary, so
TryGetValuedoes not have a long list of elements to check when looking for the key in a bucket (cf TryGetInternal(..) implementation)But in new behavior, once a page is added to the dictionary, it will stay there, so the dictionary is a lot more crowded, and
TryGetValuehas more items to scan, so the lookup takes more time.So:
Maybe you should remove empty BufferHolder instances, and put then in a BufferPool to be reused later?
@Oren I guess the "BufferHolder" represents the "ImmutableAppendOnlyList" which, as far as I know, you have been using since the early Voron days. So in that respect it is somewhat surprising seeing it featured as part of the "improved" page table design solution in this post.
I agree with Christophe that the performance issues seem to be primarily related to not removing the empty lists from the dictionary.
In fact, in the "improved" design, no entry is ever removed from the dictionary, meaning it could grow in the given benchmark example to hold around 1 million entries. This has many adverse effects and in a sense it is surprising that the other two calls became faster:
RemoveBeforenow has to scan a vastly bigger dictionary with many empty lists and it has two bugs, causing it to iterate through the full array for each "expired" entry It is a good thing we can rely on 0 initialization in c# or consequences would be more severe.TryGetValuewill now also get dictionary hits for any page ever used before, retrieving a likely empty list and scanning through either the entire list (if still empty), or stopping at the first element if it has been reused. If you had used aulongfor thebeginandendarray indices, it would have crashed with an index out of range exception.Like Christophe is saying, having your BufferHolder as class can explain increased memory usage since ConcurrentDictionary uses arrays internally and while structs have 0 overhead in an array, classes will incur ~24bytes per entry. Furthermore, this can probably lead to cache misses given the extra indirection required to access the buffer. Lastly, I wouldn't be surprised if changing the way you access the buffer cause the JIT to suddenly start emitting bounds checking instructions in the loop.
I'm not familiar enough with the precise nature of the GC to nail down exactly what's going on, but my guess would be in the fact that the original
ConcurrentDictionarywas passing around a reference to an array of struct, that is a pointer to a block of memory. On the other hand, the improvedConcurrentDictionaryis passing around a reference to a class, which then holds a reference to an array, each element of the array then is a class. Memory access has now moved from being 1 level of indirection (index into the array and there's the data) to 3 levels of indirection (get theBufferHolderclass, index the array, and dereference theTransactionPageclass). This alone would increase cache usage and significantly decrease performance. I would venture further that the GC might possibly be exacerbated by the pointers being updated constantly, which may indicate that the GC should review open pointers and see if there's anything to collect. Even if memory references are effectively the same and there is nothing to clear from memory, the GC doesn't necessarily know this and is reiterating frequently.Comment preview