Oren Eini

CEO of RavenDB

a NoSQL Open Source Document Database

Get in touch with me:

oren@ravendb.net +972 52-548-6969

Posts: 7,523
|
Comments: 51,145
Privacy Policy · Terms
filter by tags archive
time to read 4 min | 788 words

imageIn prison, the notion of counting people is sacred. This is probably because the whole point of having a prison is to keep the people you put in there inside, and that means that you count inmates, multiple times a day.

The dirty secret, however, is that you almost never get to that perfect occupancy number, where all the inmates that are registered to a particular block are actually in that block. In most cases, you have at least a few that are outside the block (court dates, medical issues with offsite care, visitations, outside work, etc).

So the key here is not just to count the inmates, but to also account for them. Let’s consider how this will look like in the user interface for counting a couple of cells, shall we?

Snapshot

This works, but it isn’t a good idea. Named counts are usually reserved for the first / last counts of the day. During the day, because it is so frequent to have inmates in and out of their assigned location, you’ll usually do things differently. You’ll have a total count of inmates in the block, and a list of the exceptions. That would look something like this:

Snapshot

You have the number of inmates in the block, how many are expected to be there, the actual count as verified by the sergeant’s signature and the named list of inmates that are not currently in the block. You might have noticed that we are carefully tracking who is responsible for any inmate that it currently out of the block. This is because that matters (for a whole host of legal and cover your ass reasons).

So how would we build such a system?

To start with, we need to talk about the current component or service that we are building. The notion of counting is typically done at the block level, so we’ll start by modeling things there. We’ll have the Block Service, which is in charge of managing anything that is going on inside the block.

A block is composed of:

  • Cells, to which inmates are assigned. This is typically an internal division only that has no real business meaning.
  • Inmates, which are quite important.
  • Staff, which is probably a separate issue entirely, but is quite important for thing such as having enough people at hand to do things like actually run the block.

In terms of the actual operations we need to do, the block is managed by at least a single Sargent per shift and multiple guards. The Sargent is responsible for handling incoming inmates, counting all inmates multiple times a day and other things that we won’t be tracking on a computer system. The guards will mostly interact with the system when they need to check an inmate out for whatever reason (such as taking them to a checkup by a nurse).

With all of this information, we can now model the data we have for a block. Here is the most important document we have, the block’s population. There are a few things here that are worth exploring in the design of the document:

image

First, we have a separate document per date, recording the state of the block’s population at that time. This is important, because we need to be able to go back in time and track such things. You can also see that the document contains a lot of data that has both the name and id. Why is that?

The information recorded on this document is the data as it was at the time of this document’s creation. Later changes do no apply, by design, since we need to see keep it at the state it was at the time.  It might be easier to look at things in code:

The most important thing here is the notion of the Log, which records every incoming and outgoing inmate from the block.

In addition to the daily’s block population document, we also have three to five counting documents, which are built on top of it. These reflect the actual counts made plus the listing of inmates that aren’t currently in the block and why.

And that is quite enough about the prison’s life. This give us sufficient level of details that we can now work with. The next post will talk about how the physical architecture and data flow in the prison.

time to read 5 min | 808 words

imageI have been writing about the internals of RavenDB for quite a while, and it is fascinating in many respects, but it gets tiring to keep thinking about bits & bytes all the time. I’m missing writing some of the more high level stuff, in particular about software architecture. So I thought that I would take the time to resurrect a very old post series of mine, Macto. I actually have quite a few posts about this, but they are all close to a decade old, so I might as well start from scratch.

Macto is a sample app for managing a prison. This is one of the few areas in which I can be an expert on the business requirements that isn’t utterly boring (I don’t want to do yet another E-Commerce stuff).  To keep up with the times, Macto is going to be written with a Micro service architecture, and just for fun, I might be doing that in multiple languages and platforms, because prison is not fun, and neither should be working on it’s computing systems Smile. Oh, and there is also the real world thing, I guess.

Since 2009, I have pretty much given up on building anything UI wise, so I’m going to show a few mockup screens, but the idea is that I’m going to be looking only at backend code, with another team actually doing the user interface.

The first thing to start with, I guess, is to paint the overall architecture of the system. Prisons are pretty rigid systems, as you might expect, but there are a lot of interconnected parts. In order to properly build a system to manage a prison we need to be able to answer what is going on from multiple points of view and from very different perspectives.

The prison commander cares about such things as the inmate’s count (the job is to keep them all hale and accounted for). The individual guard care about the particular set of cells they are assigned to and the inmates in them. The guys at Registrations care about the legal details of having a lawful warrant for holding an inmate in prison as well as when an inmate should be released. Intelligence cares about the connections between inmates, the kind of heads up that came through channels and what kind of actions should be taken as a result. Medical needs to verify that incoming inmates are fit to be held in the facility and Transfers needs to ensure that any movements of inmates outside the prison will complete successfully (as in, you got them out, you also gotta bring them all in).

Each of those pieces interact with others in interesting and complex ways. For example, incoming inmates needs to go through Registration for legal paperwork, Medical for certification, Intelligence for verification and then assigned to the proper block.  Once they are accepted into the prison, they are the charge of the particular block they are assigned to and rarely need to interact with the rest of the prison unless something extraordinary happens (visits, court, sickness, etc).

When thinking about the software architecture of such a system, the most important rule to remember is that we want the system to be used, this means that we really need to plan for what people are actually doing (in abstract of what they should be doing) and to help them do things, rather than hinder them. In most places, all these details are done with pen & paper, and it works, so our system will have to offer something more. Not to the prison administration, but to the actual people going about their work with the inmates.

From a software architecture point of view, we are going to model the system as a set of independent services that will each have the role of one of the departments inside the prison. The current term in micro-services, but in real systems, they are not so micro, so we might need to repeatedly break things apart until we get to a level in which things make sense in isolation.

A lot of the complexity is involved in managing such a system is in the flow of information across the system. In a prison, this is the responsibility of the Command & Control Center (C3, from now on) which is in charge of coordination and monitoring of actions across the board. This also work very closely with the heads of all departments and the prison commander as well as most other external parties, but it generally does nothing on its own.

I think that this is enough of an intro, and we’ll get right on to things in the next post, where we’ll talk about Counting Inmates.

time to read 6 min | 1019 words

imageAs part of our 4.0 deployment, we have a cluster made of mixed machines, some running Windows, some running Linux. In one particular configuration, we have 2 Windows services and a single Linux machine. We setup the cluster and started directing production traffic to it, and all was good. We left for the weekend and came back the following week, to see what the results were.  Our Linux machine was effectively down. It was not responding to queries and it seemed like it was non responsive.

That was good and bad. It was good because the rest of the cluster just worked, and there was no interruption in service. This is as designed, but it is always nice to see this in real life. It is bad because it isn’t supposed to be happening. What was really frustrating was that we were able to log into the machine and there was nothing wrong there.

No high CPU or memory, no outstanding I/O or anything of the kind that we are used to.

The first clue for us was trying to diagnose the problem from inside the machine, where we able to reproduce it by trying to access the server from the local machine, resulting in the exact same issue as observed externally. Namely, the server would accept the connection and just leave it hanging, eventually timing out.

That was a interesting discovery, since it meant that we can rule out anything in the middle. This is a problem in this machine. But the problem remained quite hard to figure out. We deployed to production in a manner similar to what we expect our users will do, so we used Let’s Encrypt as the certificate authority with auto generated certificates.

So we started by seeing where the problem is, whatever this is on the TCP side or the SSL side, we issued the following command:

openssl s_client -connect b.cluster-name.dbs.local.ravendb.net:443

This command showed immediate connection to the server and the client sending the ClientHello properly, but then just hanging there. What was really interesting is that if we waited about 2 minutes, that SSL connection would complete successfully. But we couldn’t figure out any reason why this would be the case. It occurred to me that it might be related to the system handling of reverse DNS lookup. The two minutes timeout was very suspicious, and I assumed that it might be trying to lookup the client certificate and somehow resolve that. That isn’t how it works in general, although the fact that some SSH (and not SSL/TLS) configuration directly relate to this has led us in a merry chase.

Eventually we pulled strace and looked into what is actually going on. We focused on the following calls:

sudo strace -fp 1017 -s 128 -Tfe open,socket,connect,sendto,recvfrom,write

The interesting bits from there are shown here:

As you can see, we are looking at some DNS resolution, as we can tell from the /etc/resolv.conf and /etc/hosts open() calls. Then we have a connect() to 172.31.0.2 which is an AWS name server. Note that this is done over UDP, as you can see from the SOCK_DGRAM option in the preceding socket() call.

We are getting some data back, and we can see identrust there. And then we see something really suspicious. We have a TCP socket call that goes to 192.35.177.64 on port 80. In other words, this is an HTTP call. What does an HTTP call is doing in the middle of an SSL handshake?

As it turned out, our firewall configuration was blocking outbound connections to port 80. We tested removing that rule and everything came back online and the server was running just fine.

Further inspection revealed that we were calling to: http://apps.identrust.com/roots/dstrootcax3.p7c

And this is where things started to jell together. We are using Let’s Encrypt certificates, and in order to ensure trust, we need to send the full chain to the user. SSL Certificates has the notion of Authority Information Access, which is basically a URL that is registered in the certificate that points to where you can find the certificate that signed this one.

Why is this using HTTP? Because the data that will be fetched is already signed, and it is not a secret. And trying to use HTTPS to fetch it might get us into a loop.

So whenever we had a new SSL connection, we’ll try to connect to IdenTrust to get the full chain to send to the client. The killer here is that if we fail to do so, we’ll send the certificate chain we have (without the missing root), but it will work, since the other side already have this root installed (usually). On Windows, this certificate is installed, so we didn’t see it. On Linux, we didn’t have that certificate installed, so we had to look it up every single time.

The gory details, including dives into the source code are in the GitHub issue. And I do think they are gory. In this case, once we realized what was going on we were able to take steps to handle this. We needed to pre-register the entire chain on the local machine, so any lookup will be able to find it locally, and not do a network call per each SSL connection.

But beyond mutating the global certificate store, there is no real way to prevent that remote call.

Note that this is also true for Windows, although that seems to be implemented much deeper in the stack, and not in managed code, so I wasn’t able to trace where this is actually happening. The really bad thing here is that from the outside, there is no way for us to control or disable this, so this is just something that you have to remember to do when you use certificates, make sure that the entire chain is registered on each machine, otherwise you might have a remote call per connection, or a very long (and synchronous!) hang until the request times out if you are blocking outgoing access.

time to read 1 min | 188 words

imageThe full RavenDB 4.0 workshop, with over 4 hours of me talking and demoing things live.  I’m covering there everything from how RavenDB stores documents, how to model your data to best take advantage of what RavenDB has to offer all the way to the need for distributed data networks and taking you step by step in setting up a cluster of nodes that replicate data to one another in real time.

The main chapters for the workshop are:

  • What is NoSQL and Why do We Need it?
  • The Value in Combining ACID and NoSQL
  • Setting up RavenDB 4.0: Installing Security
  • RavenDB 4.0: Querying, Indexing, and Dynamic Indexes
  • Setting up a Distributed Database with a RavenDB Cluster
  • Data Modeling in a NoSQL Document Database
  • Relations between Documents in RavenDB 4.0
  • Drilldown on Querying Documents with RQL
  • The Performance Advantages to Indexing with RavenDB 4.0
  • Result Projections – The Next Generation of JOIN Statements
  • Results: Includes & Hitchhiking
  • Super Fast Aggregation with Map Reduce
  • Diving into Code with RavenDB 4.0
  • Questions and Answers

You can register here to watch this workshop for free.

time to read 4 min | 621 words

imageWe got a serious situation on one of our test cases. We put the system through a lot, pushing it to the breaking point and beyond. And it worked, in fact, it worked beautifully. Up until the point that we started to use too many resources and crashed. While normally that would be expected, it really bugged us, we had provisions in place to protect us against that. Bulkheads were supposed to be blocked, operations rolled back, etc. We were supposed to react properly, reduce costs of operations, prefer being up to being fast, the works.

That did not happen. From the outside, what happened is that we go to the point where we would trigger the “sky about the fall, let’s conserve everything we can”, but we didn’t see the reaction that we expected from the system. Oh, we were started to use a lot less resources, but the resources that we weren’t using? They weren’t going back to the OS, they were still held.

It’s easiest to talk about memory in this regard. We hold buffers in place to handle requests, and in order to avoid fragmentation, we typically make them large buffers, that are resident on the large object heap.

When RavenDB detects that there is a low memory situation, it starts to scale back. It releases any held buffers, completes ongoing works and starts working on much smaller batches, etc. We saw that behavior, and we certainly saw the slow down as RavenDB was willing to take less upon itself. But what we didn’t see is the actual release of resources as a result of this behavior.

And as it turned out, that was because we were too good about managing ourselves. A large part of the design of RavenDB 4.0 was around reducing the cost of garbage collections by reducing allocations as much as possible. This means that we are running very few GCs. In fact, GC Gen 2 collections are rare on our environment. However, we need these Gen 2 collections to be able to clean up stuff that is in the finalizer queue. In fact, we typically need two such runs before the GC can be certain that the memory is not in use and actually collect it.

In this particular situation, we were careful to code so we will get very few GC collections running, and that led us to crash because we would run out of resources  before the GC could realize that we are actually not really using them at this point.

The solution, by the way, was to change the way we respond to low memory conditions. We’ll be less good about keeping all the memory around and if it isn’t being used, we’ll start discarding it a lot sooner, so the GC has better chance to actually realize that is isn’t being used and recover the memory. An instead of throwing the buffers away all at once when we have low memory and hope that the GC will be fast enough in collecting them, we’ll keep them around and reuse them, avoiding the additional allocations that processing more requests would have required.

Since the GC isn’t likely to be able to actually free them in time, we aren’t affecting the total memory consumed in this scenario but are able to reduce allocations by serving the buffers that are already allocated. This two actions, being less rigorous about policing our memory and not freeing things when we get low memory are confusingly enough to get both reduce the chance of getting into low memory and reduce the chance of actually using too much memory in such a case.

time to read 8 min | 1409 words

Technical books are interesting. Some of them last for decades, some of them are valid only for a session. I had a few discussions recently about books in a conference, in particular, what books would I recommend. That got me to really think about the topic. There are a lot of books that I think were really valuable for me when I read them that wouldn’t really make sense to recommend / talk about today. Not because they are bad books, but because both the industry and the reader have changed.

imageimageConsider a book that I was really impressed with at the time: Patterns of Enterprise Application Architecture.

It is a great book, and quite interesting. But if you’ll try to write anything based on its contents, you are doing yourselves and your employer a great disservice. This is a book that you’ll read, today, to understand how the already pre-existing libraries and frameworks are put together. Interesting, certainly, but much less relevant than when it came out over 15 years ago.

There are a lot of such cases. Books that are relevant for either the time period in which they were written, or sometimes even to the time period in the career of their reader. An example of a book that I was quite taking with is the Code Complete book. For very much the same reasons as the PoEAA book, they are much less relevant now than when they came out. This is because the ideas exposed in these books have won, they are both ubiquitous and expected.

That is not to say that you’ll always find them, or proper behavior, but that is the ground floor on which you’re expected to start from, not something that you need to aim at and strive for.

Because of this, I am actually struggling to think about good technical books that I believe would withstand the test of time. Anything that is too tech specific usually have an expiration date attached to it. And even if we are talking about concepts and ideas, I’m interested in things that will give me more than just information, but actually provide something more. A good book in this regard is something that would change how I’m doing things for a long time. A compiler book would tell me about how to write parsers and work with AST, how to generate code and and lot of details in this nature. And that would be very valuable, but it would also usually be knowledge that is very specific to a task and place. It will be generally applicable.

Thinking back over all the technical books I have read, there are just a few that I can point to and say: “This book changed the way I write code and build systems”. And these books typically are still relevant today and I can happily recommend them developers at every stage of their career.

The ones that really pops to mind are:

imageRelease It!

I read it a few times, which is pretty rare for me with technical books and I got a few copies floating around in the office so I can tell people, “Read this and you’ll get it”.

The ideas there about building robust production systems, what are the challenges and the things to watch out for are invaluable. The patterns outlined in the book, anything from circuit breaker to explicit transparency have been invaluable for the software I write.

I do have to point out that the tech in the book is often Java (circa 2010, I guess). So when the books discusses specific options, that is often not relevant, but the content and the ideas are fascinating and had made a major impact on how I write code and architect systems.

imageWorking Effectively with Legacy Code

I remember reading this book and going “Ahhh” several times over. The book talks about how you can approach a legacy codebase and make changes to it, and presumably it is useful in this regard. I read it very early in my career, before I really had the chance to get enough code to call it legacy and I have used the techniques in the book to avoid getting myself into too much trouble over time.

I should note that a lot of the things that are discussed, such as creating seams in the system so you can write tests for it are actually very useful for many other things. One of the things that I have noticed is that I will routinely make use of such seams for debugging things. To provide additional behavior and insight into what the system is doing explicitly to find a particular issue.

For some reason, I haven’t seen a lot of usage of that, but I consider debug hooks to be a really important feature of good software and I started doing that as a direct result of the kind of things that I read in Working Effectively with Legacy Software.

imageOperating Systems Concepts

I have to admit that I have a much older edition of this book, and I like that cover a lot more. But I think you will be more interested in hearing about the contents of this book.

This book, as well as Operating Systems Design and Implementation, cover how operating systems actually work, the major components and how they are actually put together. The topic may seem pretty academic and not of much use for application developers but I found it fascinating when I read it for the first time and I think it is very relevant today. Not so much the details, which are quite often different between operating systems and operating systems versions but the actual high level concepts.

It also help in understanding what is actually going on when you are running code on a machine. Things like how threading is implemented and the idea of how the OS gets to decide what runs, how memory works and how you can make use of that, etc.

I would be able to write RavenDB if I didn’t have a good grasp of all these details and the 4.0 release has been quite explicit about building software so the operating system can help us, instead of having to fight it. In order to do that, we needed to understand how the OS works, what it expects applications to do and how to actually make the best use of that.


You might note that there are a lot of books that aren’t here. Nothing about source control or writing tests, the Pragmatic Programmer or Design Patterns. To head things off at the pass, it isn’t that these are not important, but at this point, talking to an experienced  developer, I just assume that that kind of knowledge is already ingrained.


image

Federico had the following recommendation. Modern C++ Design is one of those books that literally break your understanding on how code is built and interpreted. I remember having taken this book back in early 2002 when I saw it standing on the counter of the computer science department library. I somehow convinced the secretary to give it to me under the promise of returning it, because there was a professor waiting for it. I read it completely in a week. End result, either this guy was absolutely crazy or I didnt understood a thing (latter I discovered it was not the former). So I did what anyone responsable enough would do; start all over again, and not return the book. Had to read it 3 times in the space of a month to barely grasp the concepts and got fined because of the late return 1 month later :D

I would love to hear about the books that you found fundamental to your career.

time to read 4 min | 607 words

imageRegardless of how good your software is, there is always a point where we can put more load on the system than it is capable of handling.

One such case is when you are firing about a hundred requests a second, per second, regardless of whatever the previous requests have completed and at the same time throttling the I/O so we can’t complete the requests fast enough.

What happens then is known as a convoy. Requests start piling up, as more and more work is waiting to be done, we are falling further and further behind. The typical way this ends is when you run out of resources completely. If you are using thread per requests, you end up with all your threads blocked on some lock. If you are using async operations, you start consuming more and more memory as you hold the async state of the request until it is completed.

We put a lot of pressure on the system, and we want to know that it responds well. And the way to do that is to recognize that there is a convoy in progress and handle it. But how can you do that?

The problem is that you are currently in the middle of processing a set of operations in a transaction. We can obviously abort it, and roll back everything, but the problem is that we are now in the second stage. We have a transaction that we wrote to the disk, and we are waiting for the disk to come back and confirm that the write is successful while already speculatively executing the current transaction. And we can’t abort the transaction that we are currently writing to disk, because there is no way to know at what stage the write is. 

So we now need to decide what to do. And we choose the following set of behaviors. When running a speculative transaction (a transaction that is run while the previous transaction is being committed to disk) we observe the amount of memory that is used by this transaction. If the amount of memory being used it too high, we stop processing incoming operations and wait for the previous transaction to come back from the disk.

At the same time, we might still be getting new operations to complete, but we can’t process them. At this point, after we waited for enough time to be worrying, we start proactively rejecting requests, telling the client immediately that we are in a timeout situation and that they should failover to another node.

The key problem is that I/O is, by its nature, highly unpredictable, and may be impacted by many things. On the cloud, you might hit your IOPS limits and see a drastic drop in performance all of a sudden. We considered a lot of ways to actually manage it ourselves, by limiting what kind of I/O operations we’ll send at each time, queuing and optimizing things, but we can only control the things that we do. So we decided to just measure what is going on and react accordingly.

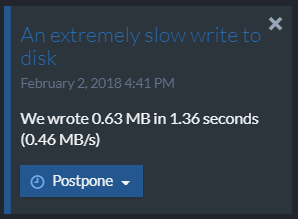
Beyond being proactive to incoming requests, we are also making sure that we’ll surface these kind of details to the user:

image

Knowing that the I/O system may be giving us this kind of response can be invaluable when you are trying to figure out what is going on. And we made sure that this is very clearly displayed to the admin.

time to read 2 min | 393 words

We took a memory dump of a production server that was exhibiting high memory usage. Here are the relevant parts:

You can already see that there is a lot of fragmentation going on. In this case, there are a few things that we want to pay special attention to. First, there are about 3GB of free space and we are seeing a lot of fragmented blocks.

image

Depending on your actual GC settings, you might be expecting some of it. We typically run with Server mode and RetainVM, which means that the GC will delay releasing memory to the operating system, so in some cases, a high amount of memory in the process isn’t an issue, but you need to see its order. If you are looking at the WinDBG output and seeing hundreds of thousands of fragments, it means that the GC will need to work that much harder when allocating. And it means that it can’t really compact memory and optimize things for higher locality, prevent their promotion to a higher GC gen, etc.

This is also usually the result of pinned memory, typically for I/O or interop. This can cause small buffers that are pinned all over the heap, but most I/O systems are well aware of that and use various tricks to avoid this. Typically by allocating large enough buffers so they would reside in the Large Object Heap, which doesn’t gets compacted very often (if ever). If you are seeing something like this in your application, the first thing to check is the number of pinned buffers and instances you are seeing.

In our case, we intentionally made a change to the system that had the side affect to pin small buffers in memory for a long time, mostly to see how bad that would be. This was to see if we could simplify buffer management somewhat. The answer was that this is quite bad, so we had to manage the buffers more proactively. We allocate a large buffer on the large object heap, then slice it into multiple segments and pool these segments. This way we get small buffers that aren’t wasting a lot of memory, but avoid high memory fragmentation because they have to be pinned for longish periods.

time to read 7 min | 1370 words

imageAbout 15 years ago I got a few Operating Systems books and started reading them cover to cover. They were quite interesting to someone who was just starting to learn that there is something under the covers. I remember thinking that this was a pretty complex topics and that the operating system had to do a lot to make everything seem to go.

The discussion of memory was especially enlightening, since the details of what was going on behind the scene of the flat memory model we usually take for granted are fascinating. In this post, I’m going to lay out a few terms and try to explain how the operating system sees it and how it impacts your application.

The operating system needs to manage the RAM, and typically there is also some swap space that is available as well to spill things to. There is also mmap files, which come with their own backing store, but I’m jumping ahead a bit.

Physical memory – The amount of RAM on the device. This is probably the simplest to grasp here.

Virtual memory – The amount of virtual memory each process can access. This is different between each process and quite different from how much memory is actually in used.

  • Reserved virtual memory – a section of virtual memory that was reserved by the process. The only thing that the operating system needs to do is not allocate anything within this range of memory. It comes with no other costs. Trying to access this memory without first committing it will cause a fault.
  • Committed virtual memory – a section of virtual memory that the process has told the operating system that they intend to use. The operating system commits to having this memory when the process actually uses it. The system can also refuse to commit memory if it choses to do so (for example, because it doesn’t have enough memory for that).
  • Used virtual memory –  a memory section that was previously committed from the operating system and is actually in use. When you commit memory, that isn’t actually doing anything. Only when you access the memory will the OS actually assign a physical memory page for that memory you just accessed. The distinction between the last two is quite important. It is very common to commit far more memory than is actually in use. By not actually taking any space until it is used, the OS can save a lot of work.

Memory mapped files – a section of the virtual address space that uses a particular file as its backing store.

Shared memory – a named piece of memory that may be mapped into more than a single process.

All of these interact with one another in non trivial manners, so it can sometimes be hard to figure out what is going on.

The interesting case happens when the amount of memory we want to access is higher than the amount of physical RAM on the machine. At this point, the operating system needs to start juggle things around and actually make decisions.

Reserving virtual memory is mostly a very cheap operation. This can be used if you will want some contiguous memory space but don’t need all of it right now. On 32 bits, the address space is quite constrained, so that can fail, but on 64 bits, you typically have enough memory address space that you don’t have to worry about it.

Committing virtual memory is where we start getting into interesting issues. We ask the operating system to ensure that we can access this memory, and it will typically say yes. But in order to make that commitment, the OS needs to look at its global state. How many other commitment did it make? In general, the amount of memory commitments that the OS can safely do is limited to the size of the RAM plus the size of the swap. Windows will simply refuse to allocate more (but it can dynamically increase the size of the swap as load grows) but Linux will happily ignore the limit and rely on the fact that applications will rarely actually make use of all the memory they are committing.

So committed memory is counted against the limit, but it isn’t memory that is actually in use. When a process is accessing memory, only then will the OS allocate that memory for it, until then, it is just a ledger entry.

But the memory on your machine is not just stuff that processes allocated. There are a bunch of other stuff that may make use of the physical memory. There are I/O bound devices, which we’ll ignore because they don’t matter for us at this point.

But of much more interest to us at this point is the notion of memory mapped files. These are most certainly memory resident, but they aren’t counted against the commit size of the system. Why is that? Because when we use a memory mapped file, by definition, we are also supplying a file that will be the backing store for this memory. That, in turn, means that we don’t need to worry about where we’ll put this memory if we need to evict some for other purposes, we have the actual file.

All of this, of course, revolves around the issue of what will actually reside in physical memory. And that leads us to another very important term:

Active working set – The portion of the process memory that resides on the physical RAM. Some portions of the process memory may have been paged to disk (if the system is overloaded or if it has just mapped a file and haven’t access the contents yet). The actual term refer to the amount of memory that the process has recently been using, and under load, the working set may be higher then the amount of memory actually in use, leading to thrashing. The OS will keep evicting pages to the page file and then loading them again, in a vicious cycle that typically kills the machines.

Now that we know all these terms, let’s take a a look at what RavenDB reports in some case:

image

The total system memory is 8 GB (about 200MB are reserved for the hardware). RavenDB is using 5.96GB and the machine entire memory usage is 1.95GB.  How can a single process in the machine use more memory than the entire machine?

The reason for that is that we aren’t always talking about the same thing. Here is the output of pertinent memory information from this machine (cat /proc/meminfo).

image

You can see that we have a total memory of 8GB, but only 140MB are free. In active use we have 2.2GB and a lot of stuff in inactive.

There is also the MemAvailable field, which says that we have 6.2GB available. But what does this means? It is a guesstimate of how much memory we can start using without starting to swap. Taking the values from top, it might be easier to understand:

image

There are about 6GB of cached data, but what is it caching? The answer is that RavenDB is making use of memory mapped files, so we gave the system extra swap space, so to speak. Here is what this looks like when looking at the RavenDB process:

image

In other words, large parts of our working set is composed of memory mapped files, and we don’t want to try to account that against the actual memory being in use in the system. Because it is very common for us to operate with almost no free memory, because that memory is being used (by the memory mapped files) and the OS knows that it can just make use of this memory if new demands comes in.

FUTURE POSTS

No future posts left, oh my!

RECENT SERIES

  1. Challenge (75):
    01 Jul 2024 - Efficient snapshotable state
  2. Recording (14):
    19 Jun 2024 - Building a Database Engine in C# & .NET
  3. re (33):
    28 May 2024 - Secure Drop protocol
  4. Meta Blog (2):
    23 Jan 2024 - I'm a JS Developer now
  5. Production Postmortem (51):
    12 Dec 2023 - The Spawn of Denial of Service
View all series

Syndication

Main feed Feed Stats
Comments feed   Comments Feed Stats
}