


Everyone talking about coding models fixates on the same number: how fast the thing generates code. This misses the point by a lot. The story isn't about how fast the model writes code I would have written anyway.
It's that the model lets me do things that I might have done before but were expensive enough that I didn’t bother. I had three separate interactions this week that led to this blog post.
We had a production problem on an instance and no clear idea what was going on. What we did have was the log: something like 25-30 MB of compressed text describing everything that happened. And the actual problem wasn't spotting an error: finding errors is easy. The problem was correlation. We needed to line up different events across the timeline and understand how they were related.
In the past, I would have to trawl through the log and hope that something would pop up. These days, we can try handing the whole thing to the model and let it figure it out. If the log file wasn’t that big, it might even work. At dozens of MB, it doesn’t work (and it is quite expensive to try).
I went the other way. I told the model: “Write me a script that looks at the structure of this log (I gave it the first ten rows). I want the script to extract and aggregate the parts I care about, and render the result in a nice table to make it easier to understand.”
I had the view in under a minute, then I could explore the log and iterate:
- “Oh, I see that there are a lot of indexes. How many of them are for the same database?”
- “Give me a histogram of index changes and their versions over time.”
The model wrote some code, produced a view, and I looked at it. Rinse & repeat until I had a pretty good idea what was going on.
The customer had several different versions of their application, each with its own set of indexes, and they kept overwriting one another, leading to a huge amount of indexing overhead. RavenDB actually has a dedicated feature for that scenario.
Here's the part that matters: I never read the code the model wrote. The moment the investigation was done, I threw all of it away. It's throwaway code whose entire purpose was to help me see, and once I had seen enough, I discarded it.
Without the model to write this code, I could have written it myself, but it is enough of a chore that it probably wouldn’t make sense. Doing that manually would have taken roughly the same amount of time.
The second interaction is the opposite kind of work. I'm doing a fairly significant refactor of how a particular query executes in Corax, and that code is going into the product and staying there for a decade or two.
Here, the model writes and I drive. I tell it the overall direction, it goes somewhere, and then I decide if I like the result. I find it genuinely easier to react to something than to produce it from a blank page — having a first draft to push against is faster than writing it all myself. Nevertheless, this is my code. I went over every single line, and I know exactly what's in there.
That last part takes real discipline, and it's worth being honest about why. When you're in the zone chasing a change (try something out, revert, try something else, etc.), it is very easy to surface a few hours later staring at two thousand lines of changes you never actually wrote. You went through a dozen iterations, and somewhere in there the code stopped being something you authored and became something that merely happened. Guarding against that is really important, because otherwise that isn’t your code.
How do I make sure it's still mine? I lean on tests, of course — regression tests to prove I didn't break the old behavior, and new tests built alongside the change to pin down the new behavior. That's the baseline for anything long-lived.
The technique I found most useful for confirming that the change is really mine is a little unusual. I had it build a harness that runs a set of scenarios against both the old version and the new one. It's a small app that issues queries and operations to the database and visualizes the results.
Here is what this looked like:
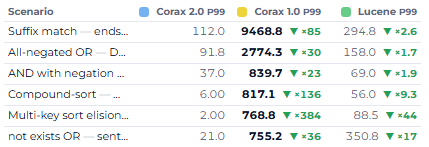
You can see that I have a bunch of scenarios that I’m testing, and it is very easy for me to track progress and know where I need to pay attention. The actual app had a lot more capabilities: what got faster, what got slower, the ranges, the memory used, everything and the kitchen sink went into that, in a format that made sense for the sort of work I was doing.
Each time I had a new direction, it was either driven by this application or I asked the model to add it to the application, so I could keep working on it. I kept working until nothing in the new version was slower than the old, and the headline paths were dramatically faster.
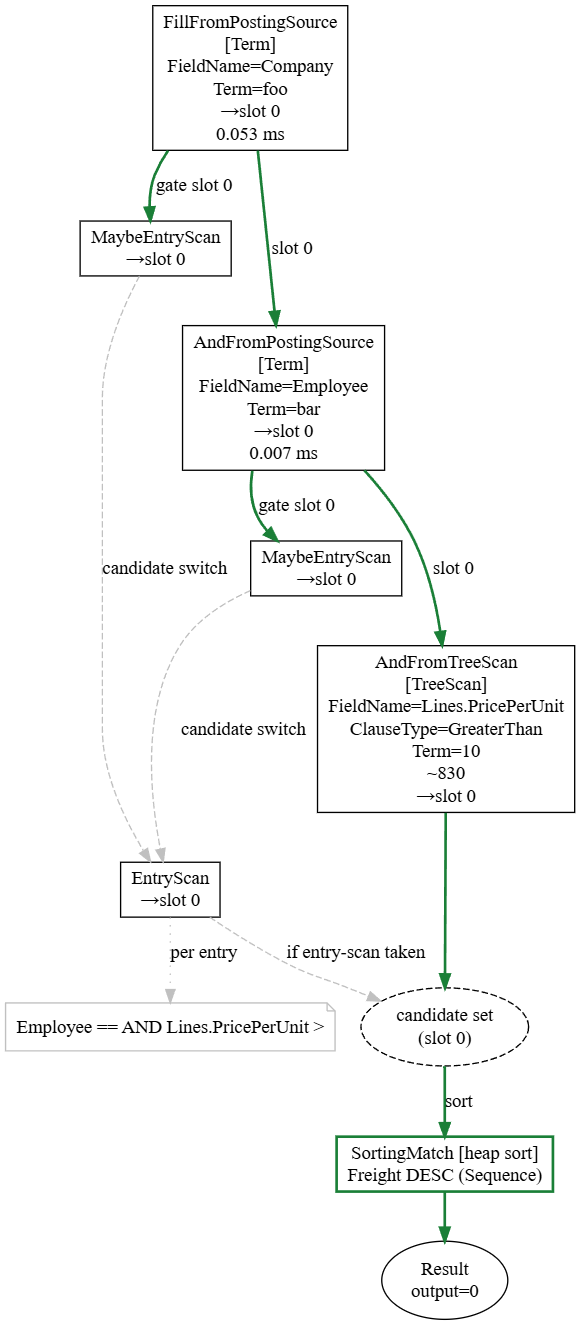
As an example of what this looked like most of the time, I ran a query, and then I inspected the structure we got back. Here is what some of that looked like:
And as I went, I kept changing the harness itself — show me this instead, group it that way. Trivial to do, because the harness is also throwaway. I'm not carrying it forward. I don't care about its code quality. I never even looked at its code. It exists to make a point, and once it's made the point, it's gone.
I also used the model to add introspection hooks and visibility into what was going on inside the system, surfacing stuff that you would usually have to scratch your head and debug to understand. That meant that I was able to look at a problematic query, then just look at its query plan and the timing in it. I usually knew where I needed to pay attention from there.
To be honest, that part feels a lot like cheating.
In the cases of the log analyzer and the comparison harness, the code is literally disposable. It’s scaffolding that would be thrown away after the work is done. I didn’t pay any attention to that code (I never read it), and it was never meant to be useful for anything else.
In the case of the production code, I went over each line of code so many times, I dreamt of it. A lot of the code there consists of annoying building blocks (building a visualization of the query plan as a graph, for example), which were sped up enormously by asking the model to build it for us. A lot of other code there is hand-crafted to say exactly what I needed it to.
But the fact that I can get good scaffolding from the model for cheap changes a lot of the usual considerations. Because scaffolding is literally disposable code, I don’t have to worry about the usual code quality concerns. The log analyzer would probably take two or three hours to write (without the pretty graphics, which were helpful for easily identifying what was going on).
The comparison harness would be multiple weeks of effort and would probably be a non-interactive ASCII table. In fact, I don’t need to guess. Scaffolding isn’t something that is new, I do that all the time. Here is an example of one, written about a decade ago:
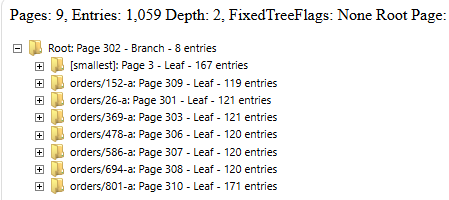
In the image above, you can find the internal structure of a B+Tree inside RavenDB. Contrast that with the following scaffolding for query plans. That one, by the way, is actually staying in the product.
Compare that to the level of insight that you can derive from the query plan higher up in this post. The B+Tree scaffolding, by the way, is essential to understanding the more complex scenarios. It paid for the time it took to write it many times over.
The ability to now effectively do the same at very little cost means that the act of building software itself is now easier. Not because someone else is writing the core code, but because everything else that we need to do is also easier.