Oren Eini

CEO of RavenDB

a NoSQL Open Source Document Database

Get in touch with me:

oren@ravendb.net +972 52-548-6969

Posts: 7,546
|
Comments: 51,161
Privacy Policy · Terms
filter by tags archive

RavenDB On Azure

time to read 1 min | 191 words

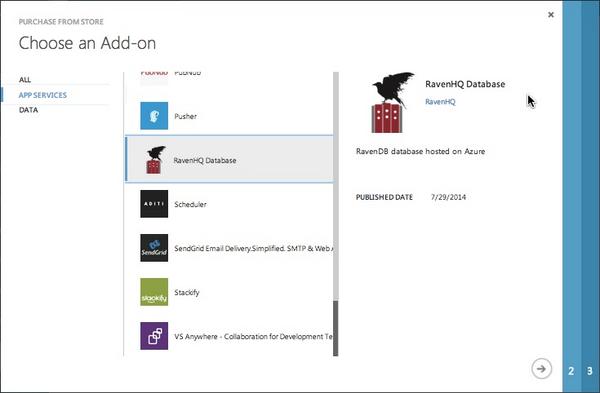
It took a while, but it is here. The most requested feature on the Azure Store is here:

Embedded image permalink

This is currently only available on the East US region. That is going to change, but it will take a bit of time. You can vote on which regions you want RavenHQ on Azure to expand to.

RavenHQ on Azure can be used in one of two ways. You can purchase it via the Azure Marketplace, in which case you have to deal only with a single invoice, and you can manage everything through the Azure site. However, the Azure Marketplace doesn’t currently support prorated and tiered billing, which means that the plans that you purchase in the marketplace have hard limits on data. You could also purchase those same plans directly from RavenHQ and take advantage of usage based billing, which allows you to use more storage than what’s included in the plan at a prorated cost.

RavenHQ is now offering a lower price point for replicated plans, so you don’t have to think twice before jumping into the high availability option.

time to read 3 min | 408 words

Recently we had to deal with several customers support requests about slow queries in RavenDB. Now, just to give you some idea about the scope. We consider a query slow if it takes more than 50ms to execute (excluding client side caching).

In this case, we had gotten reports about queries that took multiple seconds to run. That was strange, and we were able to reproduce this locally, at which point we were hit with a “Duh!” moment. In all cases, the underlying issue wasn’t that the query took a long time to execute, it was that the result of the query was very large. Typical documents were in the multi megabyte ranges, and the query returned scores of those. That means that the actual cost of the query was just transporting the data to the client.

Let us imagine that you have this query:

session.Query<User>()
.Where(x => x.Age >= 21)
.ToList();

And for some reason it is slower than you would like. The first thing to do would probably be to see what is the raw execution times on the server side:
RavenQueryStatistics queryStats;
session.Query<User>()
.Customize(x=>x.ShowTimings())
.Statistics(out queryStats)
.Where(x => x.Age > 15)
.ToList();

Now you have the following information:
  • queryStats.DurationMilliseconds – the server side total query execution time
  • queryStats.TimingsInMilliseconds – the server side query execution time, per each distinct operation
    • Lucene search – the time to query the Lucene index
    • Loading documents – the time to load the relevant documents from disk
    • Transforming results – the time to execute the result transformer, if any
  • queryStats.ResultSize – the uncompressed size of the response from the server

This should give you a good indication on the relative costs.

In most cases, the issue was resolved by the customer by specifying a transformer and selecting just the properties they needed for their use case. That transformed (pun intended) a query that returned 50+ MB to one that returned 67Kb.

time to read 1 min | 103 words

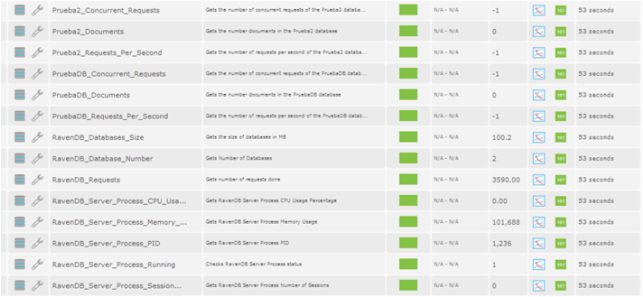
You might have noticed that we are paying a lot of options for operational concerns in RavenDB 3.0. This is especially true because we moved away from performance counters to metrics.net, which means that is is much easier and light weight to add metrics to RavenDB.

As a result of that, we are adding a lot of stuff that will be very useful for ops team. From monitoring the duration of queries to the bandwidth available for replication to a host of other stuff.

What I wanted to ask is what kind of things do you want us to track?

time to read 1 min | 162 words

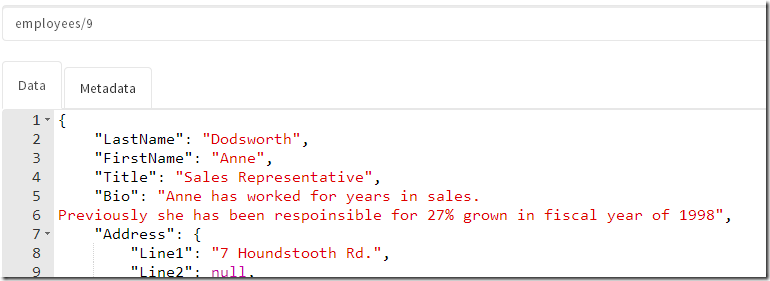
This is what we call a “mini feature”, something that you’ll probably not notice unless pointed out to you. Often, we want to store documents that contain multi line strings properties. JSON has a very simple way to handle that:

image

And it works, and if the text is small, it is even readable. But it isn’t really working on anything even remotely complex or long. So we have worked to fix that:

image

Now you can actually read this much more easily. We run into this when we look at stack trace information, where without line breaks, it is nearly impossible to see what is going on.

time to read 1 min | 142 words

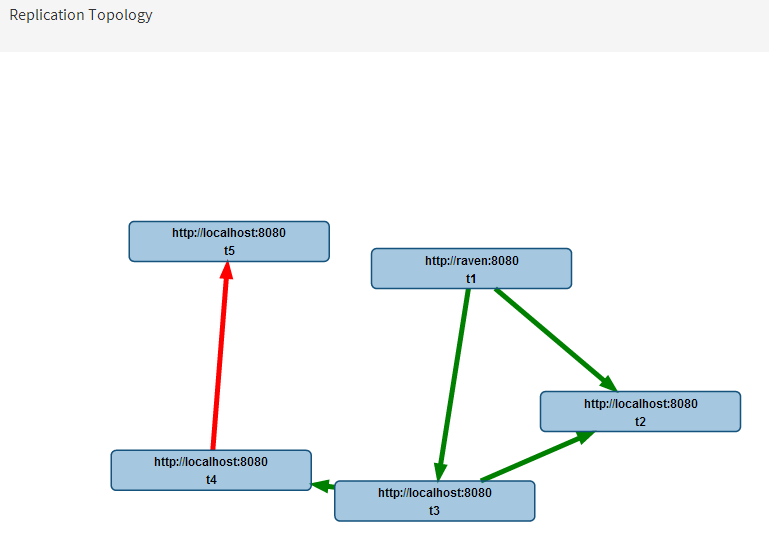
Even more goodies are coming in RavenDB 3.0. Below you can see how to visualize the replication topology in a RavenDB Cluster. You can also see that the t5 database is down (marked as red).

image

This is important, since this gives us the ability to check the status of the topology from the point of view of the actual nodes. So a node might be up for one server, but not for the other, and this will show up here.

Beside, it is a cool graphic that you can use in your system documentation and it is much easier to explain Smile.

time to read 2 min | 262 words

A customer asks in the mailing list:

Due to data protection requirements, we have to store a users data closest to where they signed up. For example if I sign up and I’m in London, my data should be stored in the EU.

Given this, how do we ensure when replicating (we will have level 4 redundancy eventually), that any data originally written to a node within say the EU does not get replicated to a node in the states?

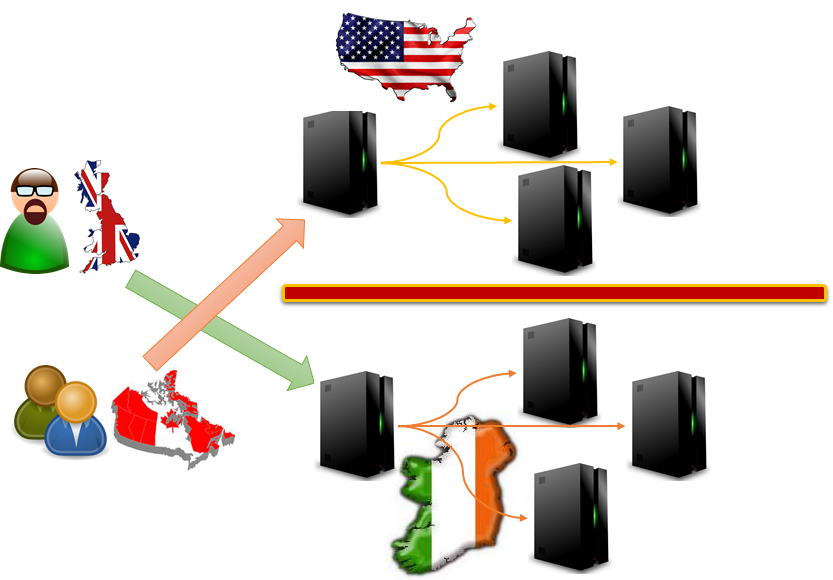
The answer here is to use to features of RavenDB together. Sharding and Replication. It is a good thing that they are orthogonal and can work together seamlessly.

Here is how it looks like:

image

The London based user will be sharded to the Ireland server. This server will be replicating to other Ireland based server (or to other servers in the EU). The data never leaves the EU (satisfying the data protection rules), but we get the high availability that we desire.

At the same time, Canadian customers will be served from a nearby states based servers, and they, too, will be replicating to nearby servers.

From a deployment standpoint, what we need to do is the following:

  • Setup a geo distributed sharded cluster using the user’s location.
  • Each shard would be a separate server, which is replicating to N other servers in the nearby geographical area.

And that is pretty much it…

time to read 4 min | 685 words

We got a customer question about a map/reduce index that produced the wrong results. The problem was a problem between the conceptual model and the actual model of how Map/Reduce actually works.

Let us take the following silly example. We want to find all the animal owner’s that have more than a single animal. We define an index like so:

// map
from a in docs.Animals
select new { a.Owner, Names = new[]{a.Name} }

// reduce
from r in results
group r by r.Owner into g
where g.Sum(x=>x.Names.Length) > 1
select new { Owner = g.Key, Names = g.SelectMany(x=>x.Names) }

And here is our input:

{ "Owner": "users/1", "Name": "Arava" }    // animals/1
{ "Owner": "users/1", "Name": "Oscar" }    // animals/2
{ "Owner": "users/1", "Name": "Phoebe" }   // animals/3

What would be the output of this index?

At first glance, you might guess that it would be:

{ "Owner": "users/1", "Names": ["Arava", "Oscar", "Phoebe" ] }

But you would be wrong. The actual output of this index… It is nothing. This index actually have no output.

But why?

To answer that, let us ask the following question. What would be the output for the following input?

{ "Owner": "users/1", "Name": "Arava" } // animals/1

That would be nothing, because it would be filtered by the where in the reduce clause. This is the underlying reasoning why this index has no output.

If we feed it the input one document at a time, it has no output. It is only if we give it all the data upfront that it has any output. But that isn’t how Map/Reduce works with RavenDB. Map/Reduce is incremental and recursive. Which means that we can (and do) run it on individual documents or blocks of documents independently. In order to ensure that, we actually always run the reduce function on the output of each individual document’s map result.

That, in turn, means that the index above has no output.

To write this index properly, I would have to do this:

// map
from a in docs.Animals
select new { a.Owner, Names = new[]{a.Name}, Count = 1 }

// reduce
from r in results
group r by r.Owner into g
select new { Owner = g.Key, Names = g.SelectMany(x=>x.Names), Count = g.Sum(x=>x.Count) }

And do the filter of Count > 1 in the query itself.

time to read 2 min | 277 words

Yes, I talked about this already, but we made some additional improvements that make it even cooler.

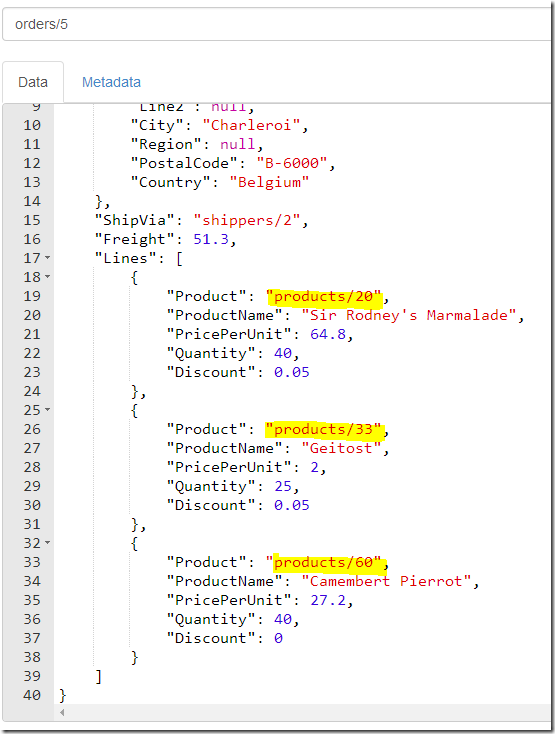
Here is a document:

image

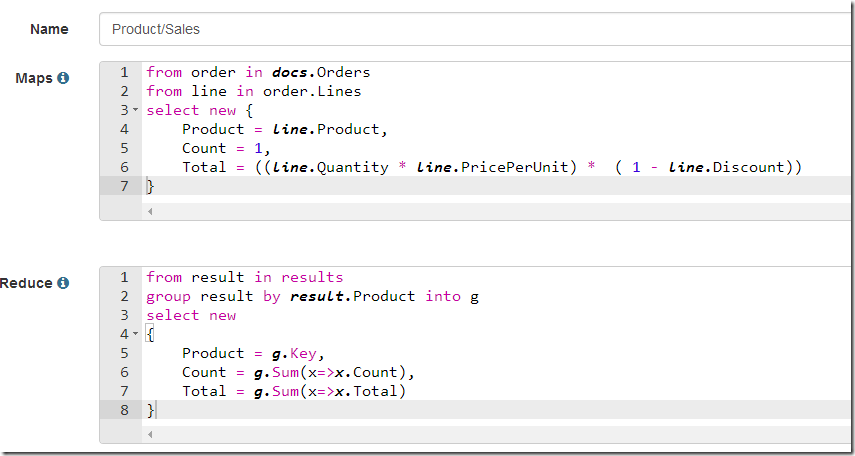
And here is the index:

image

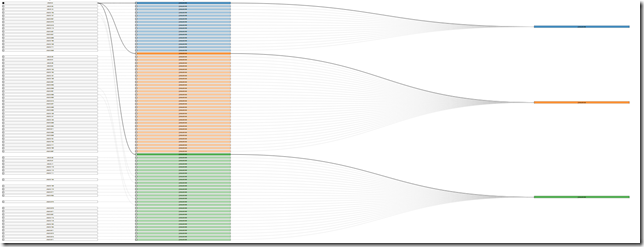
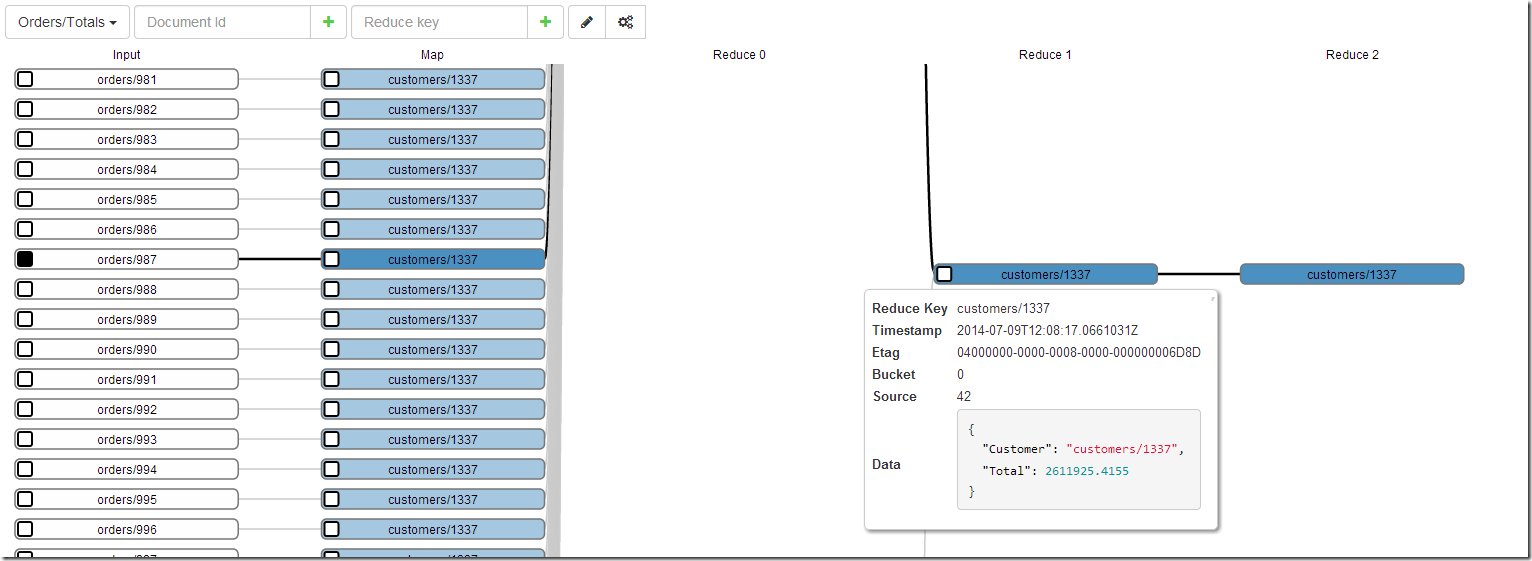
Now, let us look at what happens when we go to the map/reduce visualizer:

image

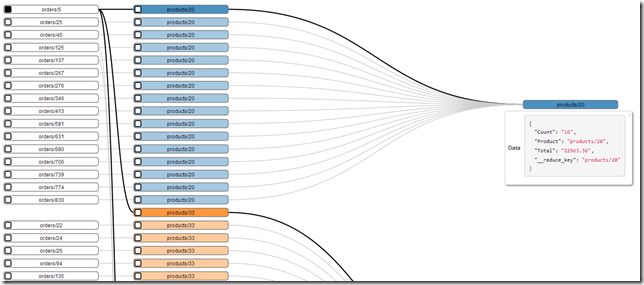
This is a highly zoomed out picture, let us zoom a little (click it for higher zoom):

image

As you can see, we can see all the documents that have any reduce keys shared with the reduce keys from the document we started from. That is going to make explaining, and debugging, map/reduce so much easier.

For that matter, here is an example of the visualizer showing us a multi step reduce. Which is an optimization that happens when we have a lot of entries for the same reduce key. Now we can actually show you how this works:

image

Pretty cool!

time to read 4 min | 627 words

Yes, I choose the title on purpose. The topic of this post is this issue. In RavenDB, we use replication to ensure high availability and load balancing. We have been using that for the past five years now, and in general, it has been great, robust and absolutely amazing when you need it.

But like all software, it can run into interesting scenarios. In this case, we had three nodes, call them A, B and C. In the beginning, we had just A & B and node A was the master node, for which all the data was written and node B was there as a hot spare. The customer wanted to upgrade to a new RavenDB version, and they wanted to do that with zero downtime. They setup a new node, with the new RavenDB server, and because A was the master server, they decided to replicate from node B to the new node. Except… nothing appear to be happening.

No documents were replicating to the new node, however, there was a lot of CPU and I/O. But nothing was actually happening. The customer opened a support call, and it didn’t take long to figure out what was going on. The setup the replication between the nodes with the default “replicate only documents that were changed on this node”. However, since this was the hot spare node, no documents were ever changed on that node. All the documents in the server were replicated from the primary node.

The code for that actually look like this:

public IEnumerable<Doc> GetDocsToReplicate(Etag lastReplicatedEtag)
{
foreach(var doc in Docs.After(lastReplicatedEtag)
{
if(ModifiedOnThisDatabase(doc) == false)
continue;
yield return doc;
}
}


var docsToReplicate = GetDocsToReplicate(etag).Take(1024).ToList();
Replicate(docsToReplicate);

However, since there are no documents that were modified on this node, this meant that we had to scan through all the documents in the database. Since this was a large database, this process took time.

The administrators on the server noted the high I/O and that a single thread was constantly busy and decided that this is likely a hung thread. This being the hot spare, they restarted the server. Of course, that aborted the operation midway, and when the database started, it just started everything from scratch.

The actual solution was to tell the database, “just replicate all docs, even those that were replicated to you”. That is the quick fix, of course.

The long term fix was to actually make sure that we abort the operation after a while, report to the remote server that we scanned up to a point, and had nothing to show for it, and go back to the replication loop. The database would then query the remote server for the last etag that was replicated, it would respond with the etag that we asked it to remember, and we’ll continue from that point.

The entire process is probably slower (we make a lot more remote calls, and instead of just going through everything in one go, we have to stop, make a bunch of remote calls, then resume). But the end result is that the process is now resumable. And an admin will be able to see some measure of progress for the replication, even in that scenario.
FUTURE POSTS

  1. Partial writes, IO_Uring and safety - about one day from now
  2. Configuration values & Escape hatches - 5 days from now
  3. What happens when a sparse file allocation fails? - 7 days from now
  4. NTFS has an emergency stash of disk space - 9 days from now
  5. Challenge: Giving file system developer ulcer - 12 days from now

And 4 more posts are pending...

There are posts all the way to Feb 17, 2025

RECENT SERIES

  1. Challenge (77):
    20 Jan 2025 - What does this code do?
  2. Answer (13):
    22 Jan 2025 - What does this code do?
  3. Production post-mortem (2):
    17 Jan 2025 - Inspecting ourselves to death
  4. Performance discovery (2):
    10 Jan 2025 - IOPS vs. IOPS
View all series

Syndication

Main feed Feed Stats
Comments feed   Comments Feed Stats
}