Oren Eini

CEO of RavenDB

a NoSQL Open Source Document Database

Get in touch with me:

oren@ravendb.net +972 52-548-6969

Posts: 7,546
|
Comments: 51,161
Privacy Policy · Terms
filter by tags archive
time to read 3 min | 407 words

I’m not talking about this much anymore, but alongside RavenDB, my company produces a set of tools to help you work with OR/M (object relational mappers) such as NHibernate or Entity Framework as well as tracking what is going on with Cosmos DB.

The profilers are implemented as two separate components. We have the Appender, which runs inside the profiled process, and the Profiler, which is a WPF application that analyzes and shows you the results of the profiling. For the profilers, all the execution is done on the users’ machine.

We have crash reporting enabled and we are diligent in fixing any and all errors from the field. We recently ran into a whole spate of errors, looking something like this:

System.NullReferenceException: Object reference not set to an instance of an object.
   at System.Windows.Controls.VirtualizingStackPanel.UpdateExtent(Boolean areItemChangesLocal)
   at System.Windows.Controls.VirtualizingStackPanel.ShouldItemsChangeAffectLayoutCore(Boolean areItemChangesLocal, ItemsChangedEventArgs args)
   at System.Windows.Controls.VirtualizingPanel.OnItemsChangedInternal(Object sender, ItemsChangedEventArgs args)
   at System.Windows.Controls.Panel.OnItemsChanged(Object sender, ItemsChangedEventArgs args)
   at System.Windows.Controls.ItemContainerGenerator.OnItemAdded(Object item, Int32 index, NotifyCollectionChangedEventArgs collectionChangedArgs)
   at System.Windows.Controls.ItemContainerGenerator.OnCollectionChanged(Object sender, NotifyCollectionChangedEventArgs args)
   at System.Windows.WeakEventManager.ListenerList`1.DeliverEvent(Object sender, EventArgs e, Type managerType)
   at System.Windows.WeakEventManager.DeliverEvent(Object sender, EventArgs args)
   at System.Collections.Specialized.NotifyCollectionChangedEventHandler.Invoke(Object sender, NotifyCollectionChangedEventArgs e)
   at System.Windows.Data.CollectionView.OnCollectionChanged(NotifyCollectionChangedEventArgs args)
   at System.Windows.WeakEventManager.ListenerList`1.DeliverEvent(Object sender, EventArgs e, Type managerType)
   at System.Windows.WeakEventManager.DeliverEvent(Object sender, EventArgs args)
   at System.Windows.Data.CollectionView.OnCollectionChanged(NotifyCollectionChangedEventArgs args)
   at System.Windows.Data.ListCollectionView.ProcessCollectionChangedWithAdjustedIndex(NotifyCollectionChangedEventArgs args, Int32 adjustedOldIndex, Int32 adjustedNewIndex)
   at System.Collections.Specialized.NotifyCollectionChangedEventHandler.Invoke(Object sender, NotifyCollectionChangedEventArgs e)
   at System.Collections.ObjectModel.ObservableCollection`1.OnCollectionChanged(NotifyCollectionChangedEventArgs e)
   at Caliburn.Micro.BindableCollection`1.OnCollectionChanged(NotifyCollectionChangedEventArgs e)
   at System.Collections.ObjectModel.ObservableCollection`1.InsertItem(Int32 index, T item)
   at Caliburn.Micro.BindableCollection`1.OnUIThread(Action action)
   at HibernatingRhinos.Profiler.Client.Sessions.SessionListModel.Add(SessionModel model)

And here is the relevant code:

image

This is called from a timer thread (not from the UI) one, and the Items collection in this case is a BindableCollection<T>.

The error is happening deep in the guts of WPF and it seems like it has been triggered by some recent Windows update. Here is the “fix” for this issue:

image

Basically, don’t report this error, and continue executing normally (the next UI operation will fix the UI state, usually within < 200 ms).

This is the right call in terms of development time and effort, but I got to say, this makes me feel quite uncomfortable to see a change like that.

time to read 3 min | 559 words

I’m very happy to announce that we have recently released version 6.0 of Entity Framework Profiler and NHibernate Profiler. Here are some of the highlights:

image

This new version brings quite a lot to the table. We applied a lot of lessons to optimize the performance of the profiler so it can process events faster and in a more efficient manner. We also fully integrated it with the async/await model that became so popular. For Entity Framework users, we now support all versions of EF, running on .NET 4.7 all the way to .NET 5.0 and anything in between.

What I think is the crown jewels of this release, however, is the new Azure integration feature. We initially built this feature to allow you to profiler serverless code and Azure Functions, but it turned out that this is really useful.

The Profiler Azure Integration allows you to setup a storage container on Azure that would accept the profiled output from your application. Pretty simple, right? The profiler application will monitor the container and show you the events as they are written, so even if you don’t have direct access to profiler the code (very common on serverless / Azure scenarios), you can still profiler your code. That helps a lot as well when talking about running inside containers, Kubernetes, etc. The usual way the profiler and the application communicate is over a TCP channel, but given the myriad of network topologies that are now in common use, this can get complex. By utilizing Azure Integration, we can resolve the whole solution and give you a seamless way to handle profile your code.

On demand profiling of your code is just one part of the new feature. You can now do continuous profiling of your system. Because we throw the events into a blob container in Azure, and given that the data is compressed and cheap to store, you can now afford to simply record all the queries in your application and come back to it a few days or weeks later and look into interesting behaviors.

That is also a large part of why we worked on improving our performance, we expect to be dealing with a lot of data.

You are also able to specify a certain timeframe for this kind of profiling, as well as specify whatever we should remove the data after looking on it or retain it. The new profiling feature gives you a way to answer: “What queries run in production on Monday between 9:17 and 10:22 AM”. This comes with all of the usual benefits of the profiler, meaning that:

  • You can correlate each query to the exact line of code that triggered it.
  • The profiler analyze the database interaction and raise alerts on bad behaviors.

The last part is done not on a single query but with access to the full state of the system. It can allow you to find hot spots in your program, patterns of data access that leads to much higher latency and cost a lot more money.

To celebrate the new release, we are offering the profilers with 20% discount for the new quarter as well as offer a bundling option. You can get the Entity Framework Profiler or the NHibernate Profiler bundled with our Cosmos DB Profiler.

time to read 2 min | 206 words

unnamed

It seems that recently we have been going in rounds. Get more people, train them, and by the time they are trained, we already need more people Smile.

I guess that this is a good problem to have. At any rate, we are currently looking for an experience well rounded developer.

This job availability is for our offices in Hadera, Israel. If you aren’t from Israel, this isn’t for you.

This job is primarily for work on our Profilers line of products. Here is the laundry list:

  • Awesome .NET skills
  • Experience in UI development using WPF, MVVM style
  • Understanding how computers work and how to make them dance
  • History with concurrency & multi threading (concurrent work history not required)
  • Architecture / design abilities

I would like to see open source history, or projects that you can share (in other words, your projects, not employer’s code that you try to give to look at).

Please contact us at jobs@hibernatingrhinos.com if you are interested.

time to read 1 min | 99 words

Well, as the year draws to a close, it is that time again, I got older, apparently. Yesterday marked my 31th trip around the sun.

To celebrate, I decided to give the first 31 people a 31% discount for all of our products.

This offer applies to:

This also applies to our support & consulting services.

All you have to do is to use the following coupon code: goodbye-2012

Enjoy the end of the year, and happy holidays.

time to read 2 min | 217 words

With Uber Prof 2.0 (NHibernate Profiler, Entity Framework Profiler, Linq to SQL Profiler, LLBLGen Profiler) we are going to bring you a new era of goodness.

In 1.0, we gave you a LOT of goodness for the development stage of building your application, but now we are able to take it a few steps further. Uber Prof 2.0 supports production profiling, which means that you can run it in production and see what is going on in your application now!

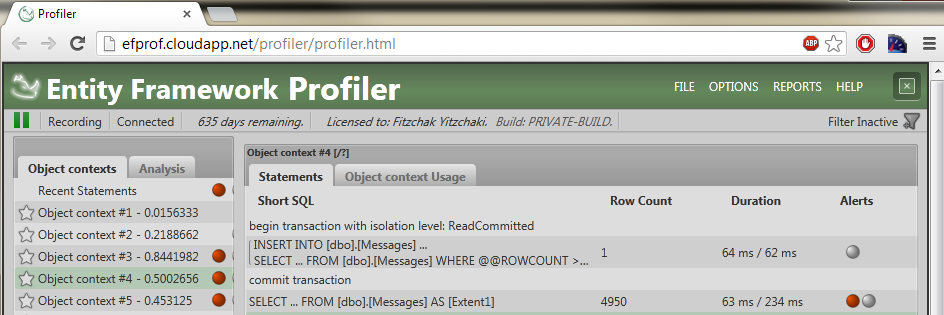
To make things even more interesting, we have also done a lot of work to make sure that this works on the cloud as well. For example, go ahead and look at this site: http://efprof.cloudapp.net/

This is a live application, that doesn’t really do anything special, I’ll admit. But the kicker is when you go to this URL: http://efprof.cloudapp.net/profiler/profiler.html

image

This is EF Prof, running on the cloud, and giving you the results that you want, live. You can read all about this feature and how to enable it here, but I am sure that you can see the implications.

time to read 1 min | 70 words

Well, it took a while, but the next version of the NHibernate Profiler is ready to go to a private beta.

We go to private beta before the product is done, because we want to get as much early feedback as we can.

We have 10 spots for NHibernate Profiler v2.0 and 10 spots for Entity Framework Profiler v2.0.

If you are interested, please send me an email about this.

time to read 1 min | 184 words

We have been working on the profilers (NHibernate Profiler, Entity Framework Profiler, Linq to SQL Profiler, LLBLGen Profiler and Hibernate Profiler) for close to three years now. And we have been running always as 1.x, so we didn’t have a major release (although we have continual releases, we currently have close to 900 drops of the 1.x version).

The question now becomes, what is going to happen in the next version of the profiler?

  • Production Profiling, the ability to setup your application so that you can connect to your production application and see what is going on right now.
  • Error Analysis, the ability to provide you with additional insight and common solution to recurring problems.
  • Global Query Analysis, the ability to take all of your queries, look at their query plans and show your potential issues.

Those are the big ones, we have a few others, and a surprise in store Smile

What would you want to see in the next version of the profiler?

FUTURE POSTS

  1. Partial writes, IO_Uring and safety - about one day from now
  2. Configuration values & Escape hatches - 5 days from now
  3. What happens when a sparse file allocation fails? - 7 days from now
  4. NTFS has an emergency stash of disk space - 9 days from now
  5. Challenge: Giving file system developer ulcer - 12 days from now

And 4 more posts are pending...

There are posts all the way to Feb 17, 2025

RECENT SERIES

  1. Challenge (77):
    20 Jan 2025 - What does this code do?
  2. Answer (13):
    22 Jan 2025 - What does this code do?
  3. Production post-mortem (2):
    17 Jan 2025 - Inspecting ourselves to death
  4. Performance discovery (2):
    10 Jan 2025 - IOPS vs. IOPS
View all series

Syndication

Main feed Feed Stats
Comments feed   Comments Feed Stats
}