Oren Eini

CEO of RavenDB

a NoSQL Open Source Document Database

Get in touch with me:

oren@ravendb.net +972 52-548-6969

Posts: 7,546
|
Comments: 51,161
Privacy Policy · Terms
filter by tags archive
time to read 1 min | 99 words

Well, as the year draws to a close, it is that time again, I got older, apparently. Yesterday marked my 31th trip around the sun.

To celebrate, I decided to give the first 31 people a 31% discount for all of our products.

This offer applies to:

This also applies to our support & consulting services.

All you have to do is to use the following coupon code: goodbye-2012

Enjoy the end of the year, and happy holidays.

time to read 2 min | 217 words

With Uber Prof 2.0 (NHibernate Profiler, Entity Framework Profiler, Linq to SQL Profiler, LLBLGen Profiler) we are going to bring you a new era of goodness.

In 1.0, we gave you a LOT of goodness for the development stage of building your application, but now we are able to take it a few steps further. Uber Prof 2.0 supports production profiling, which means that you can run it in production and see what is going on in your application now!

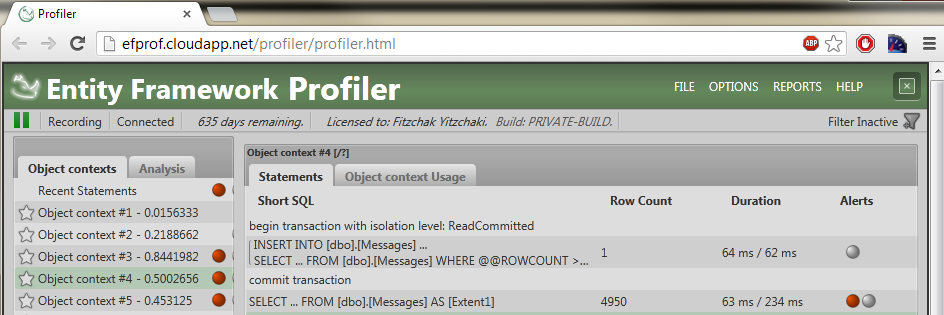
To make things even more interesting, we have also done a lot of work to make sure that this works on the cloud as well. For example, go ahead and look at this site: http://efprof.cloudapp.net/

This is a live application, that doesn’t really do anything special, I’ll admit. But the kicker is when you go to this URL: http://efprof.cloudapp.net/profiler/profiler.html

image

This is EF Prof, running on the cloud, and giving you the results that you want, live. You can read all about this feature and how to enable it here, but I am sure that you can see the implications.

time to read 1 min | 180 words

Well, we worked quite a bit on that, but the Uber Prof (NHibernate Profiler, Entity Framework Profiler, Linq to SQL Profiler, etc) version 2.0 are now out for public beta.

We made a lot of improvements. Including performance, stability and responsiveness, but probably the most important thing from the user perspective is that we now support running the profiler in production, and even on the cloud.

We will have the full listing of all the new goodies up on the company site soon, including detailed instructions on how to enable production profiling and on cloud profiling, but I just couldn’t wait to break the news to you.

In fact, along with V2.0 of the profilers, we have a brand new site for our company, which you can check here: http://hibernatingrhinos.com/.

To celebrate the fact that we are going on beta, we also offer a 20% discount for the duration of the beta.

Nitpicker corner, please remember that this is a beta, there are bound to be problems, and we will fix them as soon as we can.

time to read 1 min | 184 words

We have been working on the profilers (NHibernate Profiler, Entity Framework Profiler, Linq to SQL Profiler, LLBLGen Profiler and Hibernate Profiler) for close to three years now. And we have been running always as 1.x, so we didn’t have a major release (although we have continual releases, we currently have close to 900 drops of the 1.x version).

The question now becomes, what is going to happen in the next version of the profiler?

  • Production Profiling, the ability to setup your application so that you can connect to your production application and see what is going on right now.
  • Error Analysis, the ability to provide you with additional insight and common solution to recurring problems.
  • Global Query Analysis, the ability to take all of your queries, look at their query plans and show your potential issues.

Those are the big ones, we have a few others, and a surprise in store Smile

What would you want to see in the next version of the profiler?

time to read 3 min | 582 words

Because I keep getting asked, this feature is available for the following profilers:

This new feature detects a very interesting bad practice, write to the database from multiple session in the same web request.

For example, consider the following code:

public void SaveAccount(Account account)
{
    using(var session = sessionFactory.OpenSession())
    using(session.BeginTransaction())
    {
           session.SaveOrUpdate(account);
           session.Transaction.Commit();    
    }
}
public Account GetAccount(int id)
{
    using(var session = sessionFactory.OpenSession())
    {
        return session.Get<Account>(id);
    }
}

It is bad for several reasons, micro managing the session is just one of them, but the worst part is yet to come…

public void MakePayment(int fromAccount, int toAccount, decimal ammount)
{
    var from = Dao.GetAccount(fromAccount);
    var to = Dao.GetAccount(toAccount);
    from.Total -= amount;
    to.Total += amount;
    Dao.SaveAccount(from);
    Dao.SaveAccount(to);
}

Do you see the error here? There are actually several, let me count them:

  • We are using 4 different connections to the database in a single method.
  • We don’t have transactional safety!!!!

Think about it, if the server crashed between the fifth and sixth lines of this method, where would we be?

We would be in that wonderful land where money disappear into thin air and we stare at that lovely lawsuit folder and then jump from a high window to a stormy sea.

Or, of course, you could use the profiler, which will tell you that you are doing something which should be avoided:

image

Isn’t that better than swimming with the sharks?

time to read 3 min | 576 words

Recently, we added a way to track alerts across all the sessions the request. This alert will detect whenever you are making too many database calls in the same request.

But wait, don’t we already have that?

Yes, we do, but that was limited to the scope of one session. there is a very large set of codebases where the usage of OR/Ms is… suboptimal (in other words, they could take the most advantage of the profiler abilities to detect issues and suggest solutions to them), but because of the way they are structured, they weren’t previously detected.

What is the difference between a session and a request?

Note: I am using NHibernate terms here, but naturally this feature is shared among all profiler:

A session is the NHibernate session (or the data/object context in linq to sql / entity framework), and the request is the HTTP request or the WCF operation. If you had code such as the following:

public T GetEntity<T>(int id)
{
    using (var session = sessionFactory.OpenSession())
    {
         return session.Get<T>(id);
    }
}

This code is bad, it micro manages the session, it uses too many connections to the database, it … well, you get the point. The problem is that code that uses this code:

public IEnumerable<Friends> GetFriends(int[] friends)
{
   var results = new List<Friends>();
   foreach(var id in friends)
       results.Add(GetEnttiy<Friend>(id));

   return results;
}

The code above would look like the following in the profiler:

Image1

As you can see, each call is in a separate session, and previously, we wouldn’t have been able to detect that you have too many calls (because each call is a separate session).

Now, however, we will alert the user with a too many database calls in the same request alerts.

Image2

time to read 2 min | 213 words

We have recently been doing some work on Uber Prof, mostly in the sense of a code review, and I wanted to demonstrate how easy it was to add a new feature. The problem is that we couldn’t really think of a nice feature to add that we didn’t already have.

Then we started thinking about features that aren’t there and that there wasn’t anything in Uber Prof to enable, and we reached the conclusion that one limitation we have right now is the inability to analyze your application’s behavior beyond the session’s level. But there is actually a whole set of bad practices that are there when you are using multiple sessions.

That led to the creation of a new concept the Cross Session Alert, unlike the alerts we had so far, those alerts looks at the data stream with a much broader scope, and they can analyze and detect issues that we previously couldn’t detect.

I am going to be posting extensively on some of the new features in just a bit, but in the meantime, why don’t you tell me what sort of features do you think this new concept is enabling.

And just a reminder, my architecture is based around Concepts & Features.

time to read 1 min | 191 words

Originally posted at 1/7/2011

Because I keep getting asked, this feature is available for the following profilers:

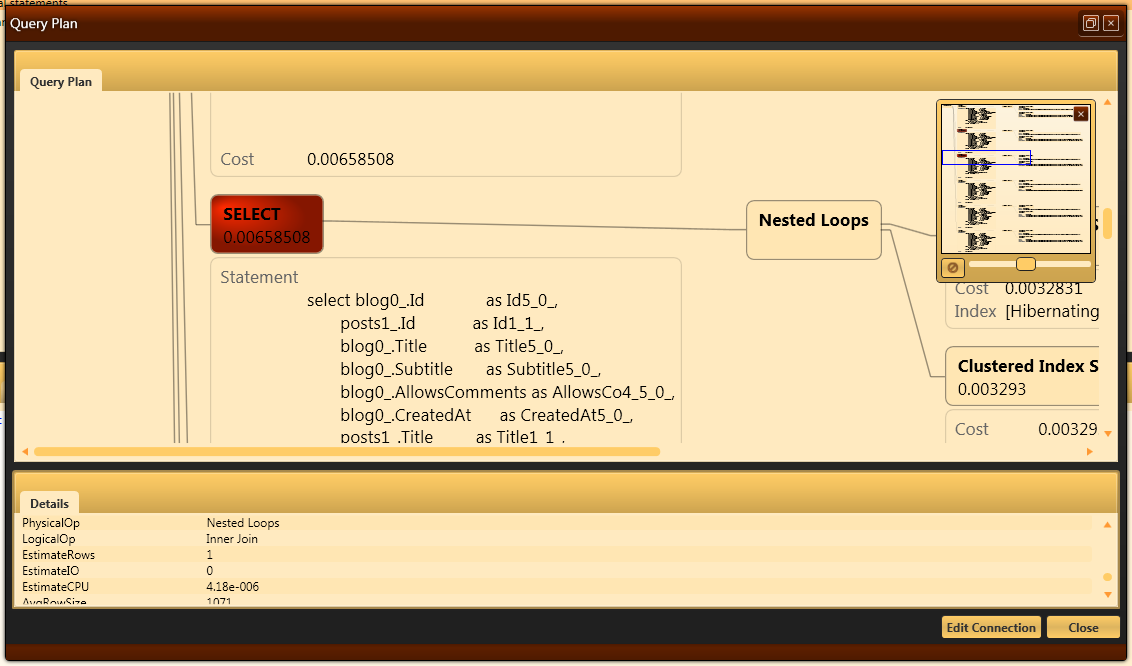
This feature is actually two separate ones. The first is the profiler detecting what is the most expensive part of the query plan and making it instantly visible. As you can see, in this fairly complex query, it is this select statement that is the hot spot.

image

Another interesting feature that only crops up whenever we are dealing with complex query plans is that the query plan can get big. And by that I mean really big. Too big for a single screen.

Therefore, we added zooming capabilities as well as the mini map that you see in the top right corner.

FUTURE POSTS

  1. Partial writes, IO_Uring and safety - about one day from now
  2. Configuration values & Escape hatches - 5 days from now
  3. What happens when a sparse file allocation fails? - 7 days from now
  4. NTFS has an emergency stash of disk space - 9 days from now
  5. Challenge: Giving file system developer ulcer - 12 days from now

And 4 more posts are pending...

There are posts all the way to Feb 17, 2025

RECENT SERIES

  1. Challenge (77):
    20 Jan 2025 - What does this code do?
  2. Answer (13):
    22 Jan 2025 - What does this code do?
  3. Production post-mortem (2):
    17 Jan 2025 - Inspecting ourselves to death
  4. Performance discovery (2):
    10 Jan 2025 - IOPS vs. IOPS
View all series

Syndication

Main feed Feed Stats
Comments feed   Comments Feed Stats
}