Profiler Speculative Feature: Query plans
This isn’t a new feature, because you can’t use it right now, but it is a really nice feature that we are working on, and I couldn’t resist showing it off hot “off the press”, so to speak.
Given the following query:
SELECT this_.id AS id7_1_,
this_.title AS title7_1_,
this_.subtitle AS subtitle7_1_,
this_.allowscomments AS allowsco4_7_1_,
this_.createdat AS createdat7_1_,
posts2_.blogid AS blogid3_,
posts2_.id AS id3_,
posts2_.id AS id0_0_,
posts2_.title AS title0_0_,
posts2_.TEXT AS text0_0_,
posts2_.postedat AS postedat0_0_,
posts2_.blogid AS blogid0_0_,
posts2_.userid AS userid0_0_
FROM blogs this_
LEFT OUTER JOIN posts posts2_
ON this_.id = posts2_.blogid
WHERE this_.id = 1 /* @p0 */
SELECT this_.id AS id0_1_,
this_.title AS title0_1_,
this_.TEXT AS text0_1_,
this_.postedat AS postedat0_1_,
this_.blogid AS blogid0_1_,
this_.userid AS userid0_1_,
comments2_.postid AS postid3_,
comments2_.id AS id3_,
comments2_.id AS id2_0_,
comments2_.name AS name2_0_,
comments2_.email AS email2_0_,
comments2_.homepage AS homepage2_0_,
comments2_.ip AS ip2_0_,
comments2_.TEXT AS text2_0_,
comments2_.postid AS postid2_0_
FROM posts this_
LEFT OUTER JOIN comments comments2_
ON this_.id = comments2_.postid
WHERE this_.blogid = 1 /* @p1 */
The profiler can show you the query plan using this UI:
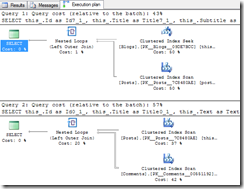
And here is how the same query looks like using the query plan feature in Management Studio:
So, why implement it?
- This isn’t limited to SQL Server, the profiler can display query plans for: SQL Server, Oracle, PostgreSQL and MySQL
- This let you keep yourself in the flow, just hit a button to see the query plan, instead of copying the SQL, opening SSMS, displaying the query plan, etc.
Don’t discount the last one, making it easy is one of the core values of the profiler.
The idea is that if you make it easy enough, the barriers for using it goes away. If you can instantly see the query plan for a query, you are far more likely to look at it than if it takes 30 seconds to get that. At that point, you would only do it when you already have a performance problem.


Comments
Cool... but is it information that is actionable?
This would be most useful if you try and provide hints about the plan and perhaps a little guidance as to how NHibernate can help or just what dabatase structure works well for NHibernate.
I would definitely use this feature. Once you've reduced the number of queries you make, optimizing the query itself is the next step if you can't or don't want to change your model.
How well does the UI scale with large query plans? One of my problems with the SSMS UI is that large query plans are a pain in the rear end to navigate. We sometimes have entities that reach into legacy DBs through views, and I find that the query plans for complex queries over those entities are sometimes unbearable through the SSMS interface.
@Barry I second that! Would be nice if there could be warnings on the query plan with suggestions!
Barry,
One step at a time, first, let us get this working, then we can start thinking about guidance.
Nick,
You can only escape complexity for so long. It work nicely, and you get the entire screen to play with, but if it is big, you'll still need to navigate it
Fact: One out of two times I open the profiler (ok, I might not use it sufficiently), my version is too old and I have to download a new ZIP file and overwrite most files.
Quote: "Don’t discount the last one, making it easy is one of the core values of the profiler."
Point: You might wanna think about adding an auto-update feature...
Also: Query plans is gonna be cool
br's
This is pretty sweet.
:(
Wish it wasn't so expensive. Would be handy.
Awesome, Ayende. This is an awesome news!
I like the cost comparison 43% / 57 % in SSMS. Please, consider something like this.
Wow - this will make a great addition! Very much looking forward to not having to switch between this and my sql management studio!
Koen,
Yes, I know, working on it
Awesome!
Similar to @Nick's comment above, I've found that I end up using the text-based query plan in SSMS (the one that displays it as if it were in an ASCII TreeView, 'SET SHOWPLAN_TEXT') instead of the graphical one, especially for large queries. Otherwise, I tend to lose track of what I'm looking at despite SSMS's zoom capabilities.
Comment preview