Oren Eini

CEO of RavenDB

a NoSQL Open Source Document Database

Get in touch with me:

oren@ravendb.net +972 52-548-6969

Posts: 7,546
|
Comments: 51,161
Privacy Policy · Terms
filter by tags archive
time to read 7 min | 1277 words

Note, this post was written by Federico.

I want first to give special thanks to Thomas, Tobi, Alex and all the others that have made so many interesting comments and coded alternative approaches. It is a great thing to have so many people looking over your work and pointing out interesting facts that in the heat of the battle with the code we could easily overlook.

It was just three weeks since I wrote this series of posts, and suddenly three weeks seems to be a lot of time. There had been very interesting discussions regarding SSE, optimization, different approaches to optimize specific issues, about lowering measurement errors, that I was intending to write down in a follow up post. However, there was an earth shattering event happening this week that just made that post I wanted to write a moot exercise.

Let’s first recap how we ended up optimizing compares.

At first we are using memcmp via P/Invoke. Everything was great for a while, until we eventually hit the wall and we needed all the extra juice we could get. Back at the mid of 2014 we performed the first optimization rounds where for the first time introduced a fully managed pointers based solution. That solution served us well, until we started to optimize other paths and really stress RavenDB 3.0.

In the second round, that eventually spawned this series, we introduced branch-tables, bandwidth optimizations, and we had to resort to every trick on the book to convince the JIT to write pretty specific assembler code.

And here we are. 3 days ago, on the 3rd of February, Microsoft released CoreCLR for everyone to dig into. For everyone interested in performance it is a one in a million opportunity. Being able to see how the JIT works, how high-performance battle tested code is written (not looking at it in assembler) is quite an experience.

In there, specifically in the guts of the mscorlib source we noticed a couple of interesting comments specifically one that said:

// The attributes on this method are chosen for best JIT performance.

// Please do not edit unless intentional.

Needless to say that caught our attention. So we did what we usually do, just go and try it Open-mouthed smile.

The initial results were “interesting” to say the least. Instantaneously we could achieve faster speed-ups for our copy routines (more on that in a future series --- now I feel lucky I didn’t wrote more than the introduction). In fact, the results were “so good” that we decided to give it a try for compare, if we could at least use the SSE optimized native routine for big memory compares we would be in a great spot.

The result of our new tests? Well, we were in for a big surprise.

We had the most optimized routine all along. The code in question:

[DllImport("msvcrt.dll", CallingConvention = CallingConvention.Cdecl, SetLastError = false)]
[SuppressUnmanagedCodeSecurity]
[SecurityCritical]
[ReliabilityContract(Consistency.WillNotCorruptState, Cer.Success)]
public static extern int memcmp(byte* b1, byte* b2, int count);

We just needed to be a bit more permissive, aka disable P/Invoke security checks.

From the MSDN documentation for SuppressUnmanagedCodeSecurity:

This attribute can be applied to methods that want to call into native code without incurring the performance loss of a run-time security check when doing so. The stack walk performed when calling unmanaged code is omitted at run time, resulting in substantial performance savings.

Well I must say substantial is an understatement. We are already running in full-trust and also memcmp is safe function by default, then no harm is done. The same cannot be said by memcpy, where we have to be extra careful. But that is another story. 

  • Size: 2 Native (with checks): 353 Managed: 207 Native (no checks): 217 - Gain: -4,608297%
  • Size: 4 Native (with checks): 364 Managed: 201 Native (no checks): 225 - Gain: -10,66667%
  • Size: 8 Native (with checks): 354 Managed: 251 Native (no checks): 234 - Gain: 7,26496%
  • Size: 16 Native (with checks): 368 Managed: 275 Native (no checks): 240 - Gain: 14,58334%
  • Size: 32 Native (with checks): 426 Managed: 366 Native (no checks): 276 - Gain: 32,6087%
  • Size: 64 Native (with checks): 569 Managed: 447 Native (no checks): 384 - Gain: 16,40625%
  • Size: 128 Native (with checks): 748 Managed: 681 Native (no checks): 554 - Gain: 22,92418%
  • Size: 256 Native (with checks): 1331 Managed: 1232 Native (no checks): 1013 - Gain: 21,61895%
  • Size: 512 Native (with checks): 2430 Managed: 2552 Native (no checks): 1956 - Gain: 30,47035%
  • Size: 1024 Native (with checks): 4813 Managed: 4407 Native (no checks): 4196 - Gain: 5,028594%
  • Size: 2048 Native (with checks): 8202 Managed: 7088 Native (no checks): 6910 - Gain: 2,575982%
  • Size: 8192 Native (with checks): 30238 Managed: 23645 Native (no checks): 23490 - Gain: 0,6598592%
  • Size: 16384 Native (with checks): 59099 Managed: 44292 Native (no checks): 44041 - Gain: 0,5699277%

The gains are undeniable, especially where it matters the most for us (16 - 64 bytes). As you can see the managed optimizations are really good, at the 2048 level and up we are able to compete with the native version (accounting for the P/Invoke that is).

The .Compare() code ended up looking like this:

[MethodImpl(MethodImplOptions.AggressiveInlining)]
public static int Compare(byte* bpx, byte* bpy, int n)
{
    switch (n)
    {
        case 0: return 0;
        case 1: return *bpx - *bpy;
        case 2:
            {
                int v = *bpx - *bpy;
                if (v != 0)
                    return v;
 
                bpx++;
                bpy++;
 
                return *bpx - *bpy;
            }
             
        default: return StdLib.memcmp(bpx, bpy, n);
    }
}
 

With these results:

  • Size: 2 - Managed: 184 Native (no checks): 238
    Size: 4 - Managed: 284 Native (no checks): 280
  • Size: 8 - Managed: 264 Native (no checks): 257
  • Size: 16 - Managed: 302 Native (no checks): 295
  • Size: 32 - Managed: 324 Native (no checks): 313

The bottom-line here is, until we are allowed to generate SSE2/AVX instructions in .Net I doubt we will be able to do a better job, but we are eagerly looking forward for the opportunity to try it out when RyuJIT is released.  *

* We could try to write our own optimized routine in C++/Assembler (if that is even possible), but that is something it is out of scope at the moment (we have bigger fishes to fry performance-wise).

time to read 3 min | 570 words

What seems to be a pretty set in stone rule of thumb is that when building a fool proof system, you will also find a better fool. In this case, the fool was us.

In particular, during profiling of our systems, we realized that we did something heinous, something so bad that it deserve a true face palm:

In essence, we spent all this time to create a really fast key/value store with Voron. We spent man years like crazy to get everything working just so… and then came the time to actually move RavenDB to use Voron. That was… a big task, easily as big as writing Voron in the first place. The requirements RavenDB makes of its storage engine are anything but trivial. But we got it working. And it worked good. Initial performance testing showed that we were  quite close to the performance of Esent, within 10% – 15%, which was good enough for us to go ahead with.

Get things working, get them working right and only then get them working fast.

So we spent a lot of time making sure that things worked, and worked right.

And then the time came to figure out if we can make things faster. Remember, Voron is heavily based around the idea of memory mapping and directly accessing values at very little cost. This is important, because we want to use Voron for a whole host of stuff. That said, in RavenDB we use it to store JSON documents, so we obviously store the JSON in it. There are quite a lot of book keeping information that we keep track of.

In particular, let us focus on the indexing stats. We need to keep track of the last indexed etag per index, when it was changed, number of successful indexing attempts, number of failed indexing attempts, etc.

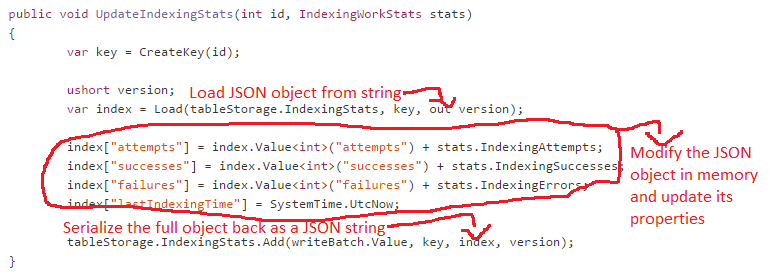
Here is how we updated those stats:

image

As you can imagine, a lot of the time was actually spent just deserializing and deserializing the data back & forth from JSON. In fact, a lot of time was spend doing just that.

Now, indexing status needs to be queried on every single query, so that was a high priority for us to fix. We did this by not storing the data as JSON, but storing the data in its raw form directly into Voron.

Voron gives us a memory of size X, and we put all the relevant data into that memory, and pull the data directly from the raw memory. No need for serialization/deserialization step.

There is a minor issue about the use of strings .While using fixed size structure (like the indexing stats) is really easy, we just read/write to that memory. When dealing with variable length data (such as strings), you have harder time at it, but we dealt with that as well by defining a proper way to encode string lengths and read them back.

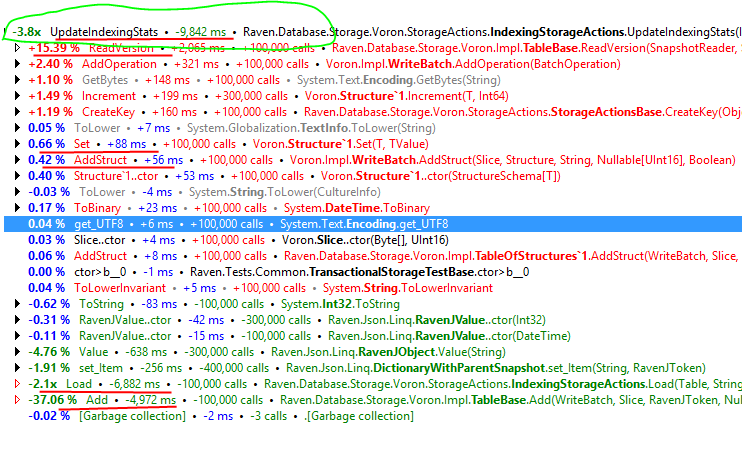
The results, by the way:

image

That means that we got close to 4 times faster! That is certainly going to help us down the road.

time to read 4 min | 673 words

In my previous post, I outlined the performance problem with facets, in this one, I want to discuss how we solved it.

For the purpose of discussion, we’ll deal with the following data model:

{ "Id": "phones/1", "Unlocked": false, "Brand": "Apple", ... }
{ "Id": "phones/2", "Unlocked": true,  "Brand": "LG", ... }
{ "Id": "phones/3", "Unlocked": false, "Brand": "Samsung", ... }
{ "Id": "phones/4", "Unlocked": true,  "Brand": "Apple", ... }
{ "Id": "phones/5", "Unlocked": false, "Brand": "Samsung", ... }

In order to handle that, we have to understand how Lucene actually work behind the scenes. Everything with Lucene is based on the notion of a document id. The results of a query is a set of document ids, and the internal structures refer to document ids on a regular basis.

So, if the result of a query is actually a set of document ids (Int32), we can represent them as a simple HashSet<int>. So far, so good. Now, we want to do a facet by the brand. How is Lucene actually storing that information?

There are two data structures of interest. The TermsEnum, which looks like this:

  • Brand:Apple – 2
  • Brand:LG –1
  • Brand:Samsung -2

This shows the number of documents per term. This is almost exactly what we would have wanted, except that this is global information, relevant for all the data. It our query is for unlocked phones only, we cannot use this data to answer the query.

For that, we need to use the TermsDocs, which looks like this:

  • Brand:Apple – [1,4]
  • Brand:LG – [2]
  • Brand:Samsung – [3,5]

So we have the term, and the document ids that contained that term.

Note that this is a very high level view of how this actually works, and it ignores a lot of stuff that isn’t actually relevant for what we need to understand here.

The important bit is that we have good way to get all the document matches for a particular term. Because we can do that, it gives us an interesting option. Instead of trying to calculate things on a case by case basis, we changed things around. We used the information inside the Lucene  index to create the following structure:

{
	"Brand": {
		"Apple": [1,4],
		"LG": [2],
		"Samsung": [3,5]
	}
}

There is caching and other obvious stuff also involved, naturally, but those aren’t important for the purpose of this talk.

Now, let us get back to our query and the required facets. We want:

Give me all the unlocked phones, and show me the facet for Brand.

A query in Lucene is going to return the following results:

[1,3,5]

Looking at the data like that, I think you can figure out where we are going with this. Here is the general algorithm that we have for answering facets.

var docsIds = ExecuteQuery();
var results = {};
foreach(var facet in facets) {
	var termsForFacet = terms[facet];
	foreach(var term in termsForFacet){
		results[facet] = CountIntersection(docIds, term.DoccumentsForTerm)
	}
}

The actual cost for calculating the facet is down to a mere set intersection, so the end result is that the performance of facets in the scenarios we test had improved by more than an order of magnitude.

I’m skipping over a lot of stuff, obviously. With facets we deal with distinct queries, ranges, dynamic aggregation, etc. But we were able to shove all of them into this style of work, and the results certainly justify the work.

Oh, and the normal case that we worked so hard to optimize normally, we are seeing 50% improvement there as well, so I’m pretty happy.

time to read 10 min | 1824 words

Facets are annoying. Mostly because they tend to be used relatively rarely, but when they are used, they are used a lot, and in many interesting ways. Because they are fairly rarely used, let me explain what they are first.

We want to show the users all the recent phones. We can do this using the following query:

from phone in session.Query<Phone>() 
orderby phone.ReleaseDate descending
select phone;

So far, so good. But we want to do better than just show a potentially big list to the user. So we start faceting the results. We pull some interesting pieces of data from the results, and allow the user to quickly narrow down the details. Typical facets for a phone query would be:

  • Brand
  • Screen Size
  • Camera
  • Cost

Now, we can certainly give the  option to search for them individually, but then you end up with something like this:

That is neither friendly nor very useful. so UX designers came up with this idea, instead:

image

This gives the user a much easier way to look at the large data sets, and quickly narrow down the search to just the things they want. It also gives the user some indication about the actual data. I can see how changing the facet selection would likely change the number of results I have. This is a great way to offer data exploration capabilities. And in any kind of data repository, this is crucial. Shopping sites are a natural choice, but content/document management systems, job sites, information centers are all commonly making use of this feature.

I’m sorry for the long intro, but I feel that this feature needs to be placed in context, to explain its history and the various iterations it has gone through.

We first got this feature in Sep 2011. It was a pull request from Matt Warren, apparently based on some code that I spiked. I intentionally goes there, because that is the first time we see this code, and it was implemented in the simplest possible manner that could possibly work, to showcase this feature and to make sure that it works end to end. The underlying implementation looked something like this:

private void HandleTermsFacet(string index, Facet facet, IndexQuery indexQuery, IndexSearcher currentIndexSearcher, 
	Dictionary<string, IEnumerable<FacetValue>> results)
{
	var terms = database.ExecuteGetTermsQuery(index,
		facet.Name,null,
		database.Configuration.MaxPageSize);
	var termResults = new List<FacetValue>();
	foreach (var term in terms)
	{
		var baseQuery = database.IndexStorage.GetLuceneQuery(index, indexQuery);
		var termQuery = new TermQuery(new Term(facet.Name, term));

		var joinedQuery = new BooleanQuery();
		joinedQuery.Add(baseQuery, BooleanClause.Occur.MUST);
		joinedQuery.Add(termQuery, BooleanClause.Occur.MUST);

		var topDocs = currentIndexSearcher.Search(joinedQuery, 1);

		if(topDocs.totalHits > 0)
			termResults.Add(new FacetValue
			{
				Count = topDocs.totalHits,
				Range = term
			});
	}

	results[facet.Name] = termResults;
}

In other words, the overall logic was something like this:

  • Get a faceted query, with a list of facets.
  • For each facet:
    • Get all the terms for the field (if this is Operating System, then that would be: Android, iOS, BlackBerry, Windows Phone)
    • For each of those terms, executed the original query and add a clause that limit the results to the current term and value.

As you can imagine, this has some.. performance issues. The more facets we had, and the more terms per facets, the costlier this got. Surprisingly enough, this code lasted almost unmodified for about 10 months, and the next major change was simply to process all of this in parallel.

Shortly thereafter, we have more changes. Moving from this trivial model to a much more efficient one, where we are executing the query once (PR from Michael Weber, by the way) per facet, instead of once per facet/term. Dynamic aggregation in RavenDB is also done through facets, and that added a much more common code path, so more changes started happening to the facets code. In particular, we started handling caching, we ended up reducing the time to run by a lot by restructuring how we were handling things so we would only executed a single query, then use low level index access to get all the other information we needed in an optimized fashion.

We got more customer usage sample, from the guys who had 70,000 facet queries to the people who wanted facets over multiple millions of results. All of that meant that we put a lot of thought into how we can reduce the performance of faceted queries, and over time, things because more and more complex, but much faster. In particular, by ordering the sequence of operations for computing the query, adding prefetching support and in general greatly reduced the amount of work we needed to do to just get the query working.

The end result was that the facet code looked something like this:

IndexedTerms.ReadEntriesForFields(currentState, fieldsToRead, allCollector.Documents,
    (term, docId) =>
    {
        List<Facet> facets;
        if (!sortedFacets.TryGetValue(term.Field, out facets))
            return;
        
        foreach (var facet in facets)
        {
            switch (facet.Mode)
            {
                case FacetMode.Default:
                    var facetValues = facetsByName.GetOrAdd(facet.DisplayName);
                    FacetValue existing;
                    if (facetValues.TryGetValue(term.Text, out existing) == false)
                    {
                        existing = new FacetValue
                        {
                            Range = GetRangeName(term)
                        };
                        facetValues[term.Text] = existing;
                    }
                    ApplyFacetValueHit(existing, facet, docId, null, currentState, fieldsCrc);
                    break;
                case FacetMode.Ranges:
                    // removed for brevity
                    break;
                default:
                    throw new ArgumentOutOfRangeException();
            }
        }

    });
});

There is a lot of stuff going on around this code, but this is where we actually computed the facets. Note that this basically calls the lambda once per every matching term for the specified fields for every document in the query.

And the performance was pretty good for our test cases, we run this through several customers who were heavy facet users, and they saw a marked improvement in performance of queries. But we recently got a customer that mentioned in passing that facet queries were expensive. As in, 5 – 10 seconds range per query. That raised some red flags, we consider requests that takes more than 100ms to be suspicious, so we asked for more information, and we realized that he was using facets slightly differently from most of our customers.

Usually, facets are used to… well, facet the data on a search. Typical performance issues with facets in the past were with large number of facets on a search result (I wasn’t kidding with the 70,000 facets). Because most of the customer feedback we got was around that, we focused on this issue primarily, to the point were even stuff like that was well behaving. This customer, however, was using facets not for searching, but as a way to manage the data itself. That meant that they were using a lot of facets on the entire data set.

So instead of having many facets on a medium size number of documents, we were using a small number of facets, but on the entire data set. Profiling this resulted in a few calls being highlighted:

  • GetOrAdd
  • TryGetValue

They are very cheap calls, on their own, but this piece of code was called literally tens of millions of times for this particular scenario. We spent some time with a profiler and started playing with the code, trying to see if we can remove the costly calls and optimize this code path.

The answers was… no. In fact, everything we did was in the range of 5% – 7% change (in both directions, mind).

This sucked, because going back to the user and saying: “that is the way it is” didn’t sit well with us. We got together, closed the shutters, turned off the light, and solely by the light of the monitors, we did a major hacking session. We completely changed the way we were handling facets, to avoid not just the problem with the calls to TryGetValue or GetOrAdd but to change direction to a much more efficient mode.

This post is getting pretty long, so I’ll discuss this in my next post. For now, can you suggest options for improvements?

time to read 4 min | 655 words

Note, this post was written by Federico. This series relies heavily on the optimization work we did on the optimizing memory comparisons, if you haven’t read it, I suggest you start there instead.

If memory compare is the bread, memory copy is the butter in an storage engine. Sooner or later we will need to send the data to disk, in the case of Voron we use memory mapped files so we are doing the copy ourselves. Voron also uses a copy-on-write methodology to deal with tree changes, so there are plenty of copy commands around. Smile

Differently from the memory compare case where an optimized version already existed. In the case of memory copy we relied on a p/invoke call to memcpy because we usually move lots of memory around and it is hard to compete in the general case with an assembler coded version.  Scrap that, it is not hard, it is extremely hard!!! Don’t underestimate the impact that SSE extensions and access to the prefetching operation can have on memcpy. [1]

However, usually not all memory copies are created equally and there is plenty opportunity to do some smart copy; our code wasn’t exactly an exception to the rule. The first work involved isolating the places where the actual “big copies” happen, especially where the cost of actually doing a p/invoke call gets diluted by the sheer amount of data copied [2] in the statistically representative case. You guessed right, for that we used our FreeDB example and the results were very encouraging, there  were a couple of instances of “big copies”. In those cases using the P/Invoke memcpy was not an option, but for the rest we had plenty of different alternatives to try.

The usual suspects to take over our P/Invoke implementation for small copies would be Buffer.BlockCopy, the MSIL cpblk operation and Buffer.Memcpy which is internal, but who cares, we can still clone it Smile.

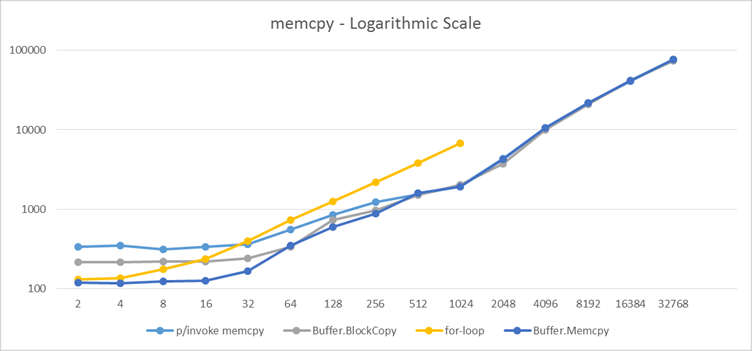
The general performance landscape for all our alternatives is:

image

What we can get from this is: Buffer.Memcpy should be the base for any optimization effort until we hit the 2048 bytes where all behave more or less in the same way. If  we have to choose between Buffer.BlockCopy and memcpy though, we will select the latter because when running in 32 bits the former is pretty bad. [3]

Having said that, the real eye opener here is the for-loop which is always a bad bet against Buffer.Memcpy. Specially because that’s usual strategy followed when copying less than 32 bytes.

There is also another interesting tidbit here, Buffer.Memcpy has some pretty nasty discontinuities around 16 bytes and 48 bytes.

Size: 14 Memcpy: 128 Stdlib: 362 BlockCopy: 223 ForLoop: 213
Size: 16 Memcpy: 126 Stdlib: 336 BlockCopy: 220 ForLoop: 235
Size: 18 Memcpy: 170 Stdlib: 369 BlockCopy: 262 ForLoop: 303
Size: 20 Memcpy: 160 Stdlib: 368 BlockCopy: 247 ForLoop: 304
Size: 22 Memcpy: 165 Stdlib: 399 BlockCopy: 245 ForLoop: 312
 
Size: 44 Memcpy: 183 Stdlib: 499 BlockCopy: 257 ForLoop: 626
Size: 46 Memcpy: 181 Stdlib: 563 BlockCopy: 264 ForLoop: 565
Size: 48 Memcpy: 272 Stdlib: 391 BlockCopy: 257 ForLoop: 587
Size: 50 Memcpy: 342 Stdlib: 447 BlockCopy: 290 ForLoop: 674
Size: 52 Memcpy: 294 Stdlib: 561 BlockCopy: 269 ForLoop: 619

What would you do here?

[1] With RyuJIT there are new vectorised operations (SIMD). We will certainly look for opportunities to implement a fully managed  version of memcpy if possible.

[2] For a detailed analysis of the cost of P/Invoke and the Managed C++/CLI Interface you can go the this article: http://www.codeproject.com/Articles/253444/PInvoke-Performance

[3] For detailed metrics check: http://code4k.blogspot.com.ar/2010/10/high-performance-memcpy-gotchas-in-c.html

time to read 3 min | 528 words

Note, this post was written by Federico. We are done with the optimizations, but the question remains. Was all this trouble worthwhile?

If you remember from the first post in this series, based on our bulk insert scenario I said that each comparison in average takes us 97.5 nanoseconds. Now let’s first define what that means.

The most important thing is to understand what are the typical characteristics of this scenarios.

  • All the inserts are in the same collection.
  • Inserts are in batches and with sequential ids.
  • Document keys share the first 10 bytes. (which is very bad for us but also explains why we have a cluster around 13 bytes).
  • No map-reduce keys (which are scattered all over the place)
  • No indexing happens.

In short, we gave ourselves a pretty bad deal.

We are dealing with a live database here, we can control the scenario, but it is insanely difficult to control the inner tasks as we do with micro-benchmarks. Therefore all percentage gains use call normalization which allows us to make an educated guess of what would have been the gain under the same scenario. The smaller the difference in calls, the less noise or jitter in the measurement.

So without further ado this is the comparison before-after with call normalization.

image

With our nightmare scenario we get a 10% improvement. We went from 97.5 nanoseconds per compare to 81.5 nanoseconds. Which is AWESOME if we realize we were optimizing an already very tight method.

What this means in context? Let’s take a look at the top user on this workload, searching a page.

Before:

image

After:

image

It seems that we got better, but also there is something different. Why those gets are missing? In the first batch of optimizations we requested the compiler to aggressively inline those properties, now those properties are part of the call-site with optimized code. A bit off-topic but when optimizing first look for these before going in an optimization frenzy.

This is the search method after optimization.

image

Our 10% improvement on the Memory Compare gave us almost an extra 4% in the search when bulk inserting. Which for a method that is called in the billions range calls on real life workloads, is pretty damn good.

And this concludes the series about memory compare, hope you have enjoyed it.

PS: With all the information provided, where do you guess I will look afterwards for extra gains?

time to read 5 min | 875 words

Note, this post was written by Federico. In the previous post after inspecting the decompiled source using ILSpy  we were able to uncover potential things we could do.

In the last post we found out that the housekeeping of our last loop is non negligible, but we also know it’s execution is bounded by n. From our static analysis we know that n cannot be bigger than a word or 8 bytes.

To build an efficient loop what we can do is exploit our knowledge on how to “hint” the compiler to build a branch table and build customized code for each one of the cases.

image

We ended up paying some housekeeping because the code gets unwieldy pretty fast. We know we can still go that road if we need to.

The performance of this loop trades comparisons with branch tables and gets rid of the comparison of n (notice that we have an endless loop here). But to squeeze the latest few nanoseconds there is a very important tidbit that could easily pass inadvertent.

Mileage will vary in real workloads but let’s do a couple of assumptions just for the purpose of illustrate the optimization.

Let’s say that in half of the requests the memory blocks are equal and on the other half they are not. That means that half of our request will be our worst case scenario, good news is that we have optimized the hell out of it. But what about the other half? For simplicity we will assume that if 2 memory blocks are different there is an uniform probability of it to be different at position n.

That means:

  • If we are comparing 3 bytes memory blocks there is a chance of 1/3 that byte-1 is different and 2/3 that it’s not.
  • If byte-1 of the memory blocks are equal, then there is 1/3 of a chance that byte-2 will be different.
  •  And so on.

For the mathematically inclined, this looks like a geometric distribution (http://en.wikipedia.org/wiki/Geometric_distribution).

image

Or the probability distribution of the number X of Bernoulli trials needed to get a desired outcome, supported on the set { 1, 2, 3, ...}

So let’s say that we have X compares to do in order to rule out equality of the memory blocks (our worst case scenario).

From Wikipedia:

image

In our example, the probability p = 0.66.  Why? Because that is the probability of “successes” until we “fail” … You will notice that success and fail are inverted in our case, because what matter to us is the failure. But mathematically speaking using the other probability would be wrong, it is just a matter of interpretation. Smile

image

Now the important tidbit here is, no matter how long is the memory block (or lower the p-value), the cumulative distribution function will always grow pretty fast. To us, that means that the chances to find a difference in the first X bytes if the memory blocks are different is pretty high. In the context of Voron, let’s say we are looking for a particular key out there in a tree. If the keys are spread apart we are going to be able to rule them out pretty fast until we are in the neighborhood of the key, where we will need to check more bytes to know for sure.

The code to achieve this optimization is quite simple, we already used it to optimize the last-loop. Smile

So we just copy the switch block into the entrance of method. If the size of the memory block is 0 to 3, we will have a fast-return. In the case of bigger memory blocks, we will consume the first 4 bytes (32 bits) before starting to test with words.

If I were to modify the original implementation and just add this optimization. What’s would the speed up be under this theoretical workload? (I will publish that in the comments section in a couple of days J so make your educated guess).

Ayende’s note: That said, there is actually another thing to consider here. It is very common for us to have keys with shared prefixes. For example, “users/1”, “users/2”, etc. In fact, we are trying hard to optimize for that route because that gives us a better structure for the internal B+Tree that we use in Voron.

time to read 3 min | 444 words

Note, this post was written by Federico. In the previous post on the topic after inspecting the decompiled source using ILSpy  we were able to uncover potential things we could do.

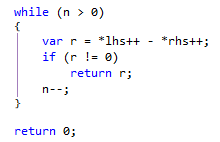
Do you remember the loop from a couple of posts behind?

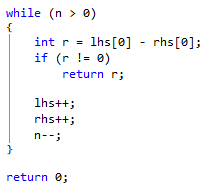
image

This loop was the responsible to check for the last bytes; either because the words compare found a difference or we are at the end of the memory block and the last block is not 8 bytes wide. You may remember it easier because of the awful code it generated.

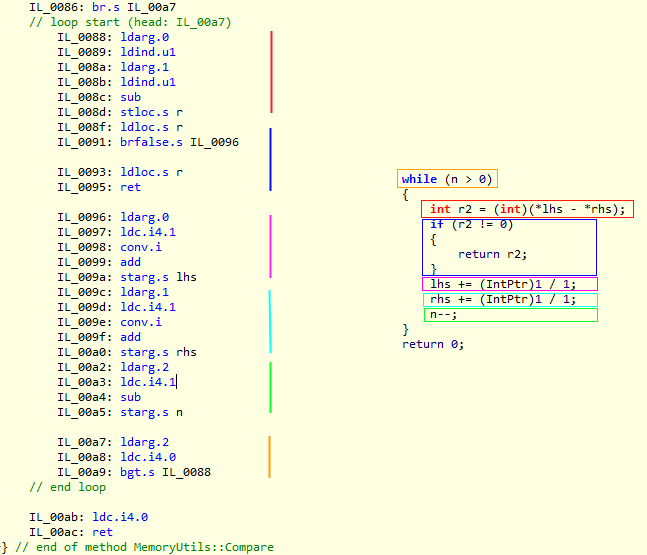
image

After optimization work that loop looked sensibly different:

image

And we can double-check that the optimization did create a packed MSIL.

image

Now let’s look at the different operations involved. In red, blue and orange we have unavoidable instructions, as we need to do the comparison to be able to return the result.

13 instructions to do the work and 14 for the rest. Half of the operations are housekeeping in order to prepare for the next iteration.

The experienced developer would notice that if we would have done this on the JIT output each one of the increments and decrements can be implemented with a single assembler operation using specific addressing mode. However, we shouldn’t underestimate the impact of memory loads and stores.

How would the following loop look in pseudo-assembler?

:START
Load address of lhs into register
Load address of R into raddr-inregister
Move value of lhs into R
Load byte into a 32 bits register (lhs-inregister)
Substract rhs-inregister, [raddr-inregister],
Load int32 from R into r-inregister
Jump :WEAREDONE if non zero r-inregister,
Load address of lhs into lhsaddr-register
Add 4 into [lhsaddr-register] (immediate-mode)
Load address of rhs into rhsaddr-register
Add 4 into [rhsaddr-register]   (immediate-mode)
Load address of n into naddr-register
Increment [naddr-register]
 
Load content of n into n-register
Jump :START if bigger than zero n-register
Push 0
Return
 
:WEAREDONE
Push r-inregister
Return

As you can see the housekeeping keeps being a lot of operations. J

Armed with this knowledge. How would you optimize this loop?

time to read 5 min | 883 words

Note, this post was written by Federico. In the previous post after inspecting the decompiled source using ILSpy  we were able to uncover potential things we could do.

By now we already squeeze almost all the obvious inefficiencies that we had uncovered through static analysis of the decompiled code, so now we will need another strategy. For that we need to analyze the behavior in runtime in the average case. We did something like that when in this post when we made an example using a 16 bytes compare with equal arrays.

To achieve that analysis live we will need to somehow know the size of the typical memory block while running the test under a line-by-line profiler run. We built a modified version of the code that stored the size of the memory chunk to compare and then we built an histogram with that (that’s why exact replicability matters). From our workload the histogram showed that there were a couple of clusters for the length of the memory to be compared. The first cluster was near 0 bytes but not exactly 0. The other cluster was centered around 12 bytes, which makes sense as the keys of the documents were around 11 bytes. This gave us a very interesting insight. Armed with that knowledge we made our first statistical based optimization.

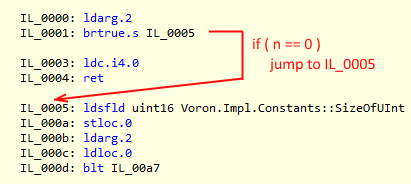
You can notice the if statement at the start of the method, which is a pretty standard bounding condition. If the memory blocks are empty, therefore they are equal. In a normal environment such check is so simple that nobody would bother, but in our case when we are measuring the runtime in the nanoseconds, 3 extra instructions and a potential branch-miss do count.

That code looks like this:

image

That means that not only I am making the check, we are also forcing a short-jump every single time it happens. But our histogram also tells us that memory blocks of 0 size almost never happen. So we are paying with 3 instructions and a branch for something that almost never happen. But we also knew that there was a cluster near the 0 that we could exploit. The problem is that we would be paying 3 cycles (1 nanosecond in our idealized processor) per branch. As our average is 97.5 nanoseconds, we have 1% improvement in almost any call (except the statistically unlikely case) if we are able to get rid of it.

Resistance is futile, that branch needs to go. Smile

In C and Assembler and almost any low level architecture like GPUs, there are 2 common approaches to optimize this kind of scenarios.

  • The ostrich method. (Hide your head in the sand and pray it just work).
  • Use a lookup table.

The first is simple, if you don’t check and the algorithm can deal with the condition in the body, zero instructions always beats more than zero instruction (this case is a corner case anyways, no damage is dealt). This one is usually used in massive parallel computing where the cost of instructions is negligible while memory access is not. But it has its uses in more traditional superscalar and branch-predicting architectures (you just don’t have so much instructions budget to burn).

The second is more involved. You need to be able to “index” somehow the input and pay with less instructions than do the actual branches (at a minimum of 1 nanosecond each aka 3 instructions of our idealized processor). Then create a branch table and jump to the appropriate index which itself will jump to the proper code block using just 2 instructions.

Note: Branch tables are very well explained at http://en.wikipedia.org/wiki/Branch_table. If you made it that far you should read it, don’t worry I will wait.

As the key take away if your algorithm have a sequence of 0..n, you are in the best world, you already have your index. Which we did Smile.

I know what you are thinking: Will the C# JIT compiler be smart enough to convert such a pattern into a branch table?

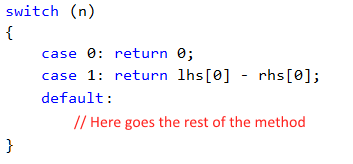
The short answer is yes, if we give it a bit of help. The if-then-elseif pattern won’t cut it, but what about switch-case?

The compiler will create a switch opcode, in short our branch table, if our values are small and contiguous.

Therefore that is what we did. The impact? Big, but this is just starting. Here is what this looks like in our code:

image

I’ll talk about the details of branch tables in C# more in the next post, but I didn’t want to leave you hanging too much.

time to read 3 min | 502 words

Note, this post was written by Federico. In the previous post after inspecting the decompiled source using ILSpy  we were able to uncover potential things we could do. In this fragment we have a pretty optimized method to compare an entire 4 bytes per loop. What if we could do that on 8 bytes?

To achieve that we will use a ulong instead of a uint. This type of optimization makes sense for 2 reasons.

Most of our users are already running RavenDB in x64 where the native word is 8 bytes and Voron is compiled on x64 only. But even if that were not true, since the late 2000’ most CPUs would have a 64 bytes L1 cache line with half a cycle cost for a hit. So even if you can’t handle 64 bits in one go and the JIT or processor have to issue 2 instructions you are still getting a L1 cache hit and no pipeline stall. Which is GREAT Smile.

So without farther ado, this is the resulting code:

image

Ayende’s note: In the code, the lp += (IntPtr)8/8; is actually defined as lp += 1; What is actually happening is that we are increasing by 8 bytes (size of ulong), and this is how ILSpy decided to represent that for some reason.

The actual IL generated for this is good:

image

It is just that the translation here is kind of strange.

Therefore the question to ask here is: Will skipping over the parts of the memory block that is equal at a faster rate will compensate for the cost of doing a final check with 8  bytes instead of 4 bytes?

Well the answer is a resounding yes. It won’t have much impact in the first 32 bytes (around 3% or less). We won’t lose, but we won’t win much either. But after that it skyrocket.

// Bandwidth optimization kicks in
Size:       32 Original:     535 Optimized:   442 Gain:    5.01%
Size:       64 Original:     607 Optimized:   493 Gain:    7.08%
Size:    128 Original:     752 Optimized:   573 Gain:   11.77%
Size:     256 Original: 1,080 Optimized:   695 Gain:   35.69%
Size:     512 Original: 1,837 Optimized:   943 Gain:   74.40%
Size: 1,024 Original: 3,200 Optimized: 1,317 Gain: 122.25%
Size: 2,048 Original: 5,135 Optimized: 2,110 Gain: 123.13%
Size: 4,096 Original: 8,753 Optimized: 3,690 Gain: 117.29%

Those are real measurements. You can see that when bandwidth optimization kicks in the gains start to get really high. This means that changing the bandwidth size alone from 4 byte to 8 bytes got us an order of magnitude improvement stabilizing around 120%.

Not bad for 2 lines of work.

FUTURE POSTS

  1. Partial writes, IO_Uring and safety - about one day from now
  2. Configuration values & Escape hatches - 5 days from now
  3. What happens when a sparse file allocation fails? - 7 days from now
  4. NTFS has an emergency stash of disk space - 9 days from now
  5. Challenge: Giving file system developer ulcer - 12 days from now

And 4 more posts are pending...

There are posts all the way to Feb 17, 2025

RECENT SERIES

  1. Challenge (77):
    20 Jan 2025 - What does this code do?
  2. Answer (13):
    22 Jan 2025 - What does this code do?
  3. Production post-mortem (2):
    17 Jan 2025 - Inspecting ourselves to death
  4. Performance discovery (2):
    10 Jan 2025 - IOPS vs. IOPS
View all series

Syndication

Main feed Feed Stats
Comments feed   Comments Feed Stats
}