Oren Eini

CEO of RavenDB

a NoSQL Open Source Document Database

Get in touch with me:

oren@ravendb.net +972 52-548-6969

Posts: 7,546
|
Comments: 51,161
Privacy Policy · Terms
filter by tags archive
time to read 1 min | 189 words

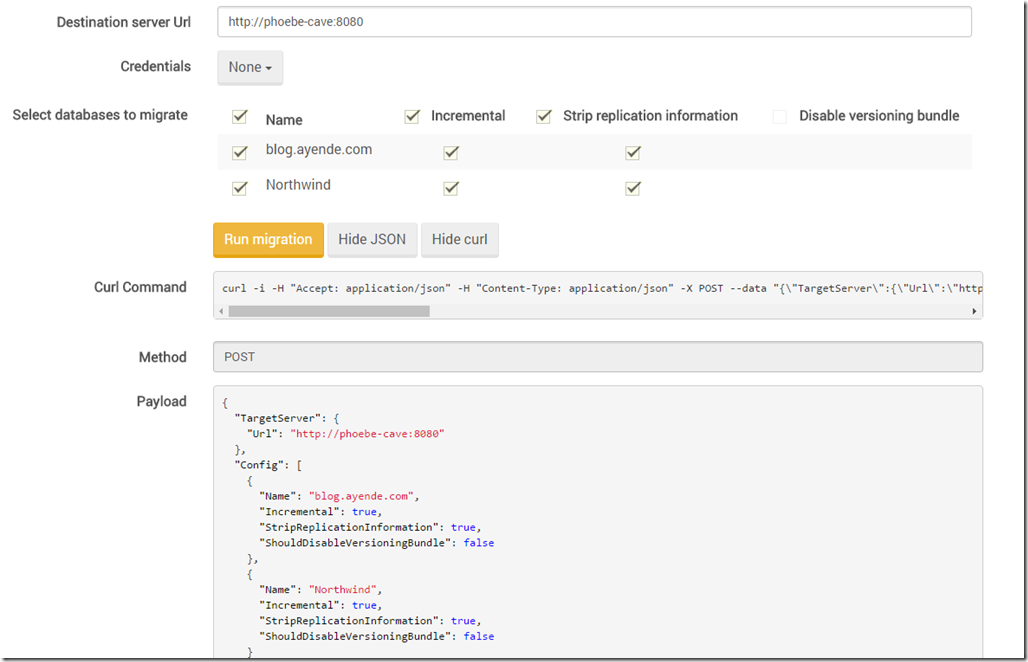
Here we have another aspect of making operations’ life easier. Supporting server-side import/export, including multiple databases, and using various options.

image

Leaving aside the UI bugs in the column alignment (which will be fixed long before you should see this post), there are a couple of things to note here. I have actually written about this feature before, although I do think that this is a snazzy feature.

What is more important is that we managed to get some early feedback on the released version from actual ops people and then noted that while this is very nice, what they actually want is to be able to script this. So this serves as both the UI for activating this feature, and also generating the curl script to execute it from a cron job.

As a reminder, we have the RavenDB Conference in Texas in a few months, where we’ll present RavenDB 3.5 in all its glory.

image

time to read 2 min | 286 words

A natural consequence of RavenDB decision to never reject writes (a design decision that was influenced heavily by the Dynamo paper) is that it is possible for two servers to get client writes to the same document without coordination. RavenDB will detect that and handle it. Here is a RavenDB 2.5 in conflict detection mode, for example:

clip_image012

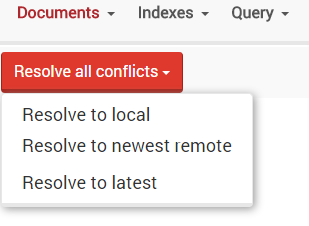
In RavenDB 3.0, we added the ability to have the server resolve conflicts automatically, based on a few predefined strategies.

image

This is in addition to giving you the option for writing your own conflict resolution strategies, which can apply your own business logic.

What we have found was that while some users deployed RavenDB from the get go with the conflict resolution strategy planned and already set, in many cases, users were only getting around to doing this when they actually had this happen in their production systems. In particular, when something failed to the user in such a way that they make a fuss about it.

At that point, they investigate, and figure out that they have a whole bunch of conflicts, and set the appropriate conflict resolution strategy for their needs. But this strategy only applies to future conflicts. That is why RavenDB 3.5 added the ability to also apply those strategies in the past:

Capture

Now you can easily select the right behavior and apply it, no need to worry.

time to read 2 min | 337 words

Data subscriptions in RavenDB are a way for users to ask RavenDB to give the user all documents matching a particular query, both past and future. For example, I may open a subscription to handle all Orders mark as "Require Review", for example.

The nice thing about is that when I open a subscription, I can specify whatever I want to get only new documents, or if I want to process all documents from the beginning of time. And once I have process all the documents in the database, RavenDB will be sure to call me out whenever there is a new document that matches my parameters. RavenDB will ensure that even if there is some form of failure in processing a new document, I'll get it again, so I can retry.

This is a really great way to handle background jobs, process incoming documents, go over large amount of data efficiently, etc.

That said, subscriptions have a dark side. Because it is common for subscriptions to process all the relevant documents, they are frequently required to go over all the documents in the database. The typical use case is that you have a few active subscriptions, and mostly they are caught up and processing only new documents. But we have seen cases where users opened a subscription per page view, which results in us having to read the entire database for each and every page view, which consumed all our I/O and killed the system.

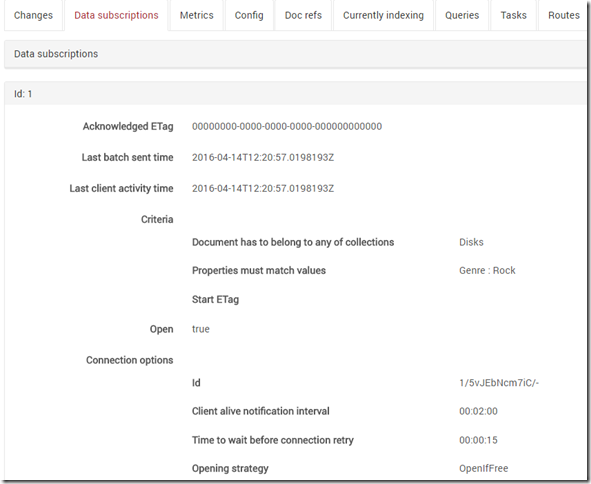
In order to handle that, we added a dedicated endpoint to monitor such cases, and you can see one such subscription below.

image

In this case, this is  relatively new subscription, which has just started processing documents, and it is for all the Disks in the Rock genre.

This make it easier for the operation team to figure out what is going on on their server.

time to read 3 min | 436 words

RavenDB replication had a load balancing mode for quite some time, using round robin balancing between all the nodes.

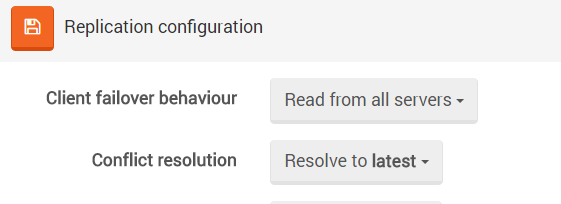
With RavenDB 3.5, we have added support for Service Level Agreements with the load balancing. You can configure it like so:

image

What this does is instruct the client to define a policy, and if a server starts responding too slowly for the provided policy, we are going to reduce the number of requests that we are going to send its way. For example, let us say that we use the default 100ms per request, with three nodes.

We start with all read requests being spread across all three servers. All of them respond pretty much the same, so we have no reason to change the load allocation. Now, and administrator is running a full backup on one of the nodes, which can consume quite a lot of I/O, so requests from this node suffer and become slower. The moment that those requests start going over the 100ms limit, RavenDB wakes up, and say: "It isn't nice to violate the SLA, maybe I won't visit as often", and start changing the request allocation away from this server.

Note that we aren't going to stop talking to it directly, the RavenDB client will just fewer requests its way, until either the server is able to keep up with the load in the given SLA. As long as it can't keep up with the SLA, we will further reduce the number of requests. This whole approach uses decaying semantics, so new responses are more important than old responses, which means that as soon as the backup operation completes and we have free I/O, RavenDB will detect that and ramp up the number of requests until we are balanced again.

We actually have two modes here. One of them (shown above) talks only to the primary, and if the SLA is violated, it will then start directing queries to other servers. The second mode is to spread the load along all servers, and only use the servers that are under the provided SLA. I think that the second mode is more interesting, but the first one is easier to reason about, because it is a simple overflow model.

As a reminder, we have the RavenDB Conference in Texas in a few months, which would be an excellent opportunity to see RavenDB 3.5 in all its glory.

image

time to read 2 min | 303 words

The indexing process in RavenDB is not trivial, it is composed of many small steps that need to happen and coordinate with one another to reach the end goal.

A lot of the complexity involved is related to concurrent usage, parallelization of I/O and computation and a whole bunch of other stuff like that. In RavenDB 3.0 we added support for visualizing all of that, so you can see what is going on, and can tell what is taking so long.

With RavenDB 3.5, we extended that from just looking at the indexing documents to looking into the other parts of the indexing process.

unnamed

In this image, you can see the green rectangles representing prefetching cycles of documents from the disk, happening alongside indexing cycles (representing as the color rectangles, with visible concurrent work and separate stages.

The good thing about this is that it make it easy to see whatever there is any waste in the indexing process, if there is a gap, we can see it and investigate why that happens.

Another change we made was automatic detection of corrupted Lucene indexes (typical case, if you run out of disk space, it is possible that the Lucene index will be corrupted, and after disk space is restored, it is often not recoverable by Lucene), so we now can automatically detect that scenario and apply the right action (trying to recover from a previous instance, or resetting the index).

As a reminder, we have the RavenDB Conference in Texas in a few months, which would be an excellent opportunity to see RavenDB 3.5 in all its glory.

image

time to read 3 min | 491 words

So far I talked mostly about the visible parts of the stuff that we did in RavenDB 3.5, stuff that has a user interface and is actually easy to talk about. In this post, I'm going to dive a bit into the stuff that goes in the core, which no one usually notices except us, except when it breaks.

RavenDB Lucene Parser

A frequent cause for complaint with RavenDB is the fact that the Lucene Query Parser is relying on exceptions for control flow. That means that if you are debugging a test that is using RavenDB, you are likely to be stopped by LookAheadSuccessException during debugging. This is handled internally, but the default VS configuration will stop on all exception, which caused more than a single person to assume that there is actually some error and post a question to the mailing list.

But the reason we decided to implement our own parser wasn't the issue of exceptions. It was performance and stability. RavenDB doesn't actually use Lucene syntax for queries, we have extended in in several ways (for example, the @in<Group>: (Relatives ,Friends) syntax). Those extensions to the syntax were implemented primarily as pre and post processing over the raw query string using regular expressions. And you know the saying about that. Under profiling, it turned out that significant amount of time was spent in these processing, and in particular, in those regexes.

All of which gives us an extremely efficient parser, no exceptions during the parsing and a formal grammer that we can stick to. If you care, you can read the full grammar here.

Explicit thread management for indexing

In RavenDB 3.0, we rely on the standard .NET ThreadPool for index execution, this has led to some interesting issues related to thread starvation, especially when you have many concurrent requests that take up threads. The fact that the .NET ThreadPool has a staggered growth pattern also have an impact here, in terms of how much we are actually scale out there.

By creating our own thread pool, decided for our own stuff, we are able to do things that you can't do in the global thread pool. For example, we can respond to CPU pressure by reducing the priority of the indexing thread pool threads, so we'll prefer to process request than do background work. We also have a more predictable behavior around indexing batches and abandon an index midway through an index to ensure liveliness for the entire indexing process.

And what is almost as important, the fact that we have our own thread pool for indexing means that we can now much more easily report and monitor it. Which make our lives much easier in production.

As a reminder, we have the RavenDB Conference in Texas in a few months, which would be an excellent opportunity to see RavenDB 3.5 in all its glory.

image

time to read 5 min | 820 words

I spoke a lot about relatively large features, such as Clustering, Global Configuration and the Admin Console. But RavenDB 3.5 represent a lot of time and effort from a pretty large team. Some of those changes you'll probably not notice. Additional endpoints, better heuristics, stuff like that, and some of them are small tiny features that get lost in the crowd. This post is about them.

Sharding

RavenDB always had a customizable sharding strategy, while the default sharding strategy is pretty smart, you can customize it based on your own knowledge of your system. Unfortunately, we had one trouble about that. While you could customize it, when you did so, it was pretty much an all or nothing approach. Instead of RavenDB analyzing the query, extracting the relevant servers to use for this query and then only hitting them, you got the query and had to do all the hard work yourself.

In RavenDB 3.5, we changed things so you have multiple levels of customizing this behavior. You can still take over everything, if you want to, or you can let RavenDB do all the work, give you the list of servers that it things should be included in the query, and then you can apply your own logic. This is especially important in scenarios where you split a server. So the data that used to be "RVN-A" is now located on "RVN-A" and on "RVN-G". So RavenDB analyze the query, does it things and end up saying, I think that I need to go to "RVN-A", and then you can detect that and simply say: "Whenever you want to go to RVN-A, also go to RVN-G". So the complexity threshold is much lowered.

Nicer delete by index

The next feature is another tiny thing. RavenDB supports the ability to delete all record matching a query. But in RavenDB 3.0, you have to construct the query yourself (typically you would call ToString() on an existing query) and the API was a bit awkward. In RavenDB 3.5, you can now do the following:

await session.Advanced.DeleteByIndexAsync<Person, Person_ByAge>(x => x.Age < 35);

And this will delete all those youngster from the database, easy, simple, and pretty obvious.

I did mention that this was the post about the stuff that typically goes under the radar.

Query timings and costs

This nice feature appears in the Traffic Watch window. When you are looking into queries, you'll now not only get all the relevant details about this query, but will also be able to see the actual costs in serving it.

image

In this case, we are seeing a very expensive query, even though it is a pretty simple one. Just looking at this information, I can tell you why that is.

Look into the number of results, we are getting 22 out of 1.4 millions. The problem is that Lucene doesn't know which ones to return, it need to rank them by how well they match the query. In this case, they all match the query equally well, so we waste some time sorting the results only to get the same end result.

Explain replication behavior

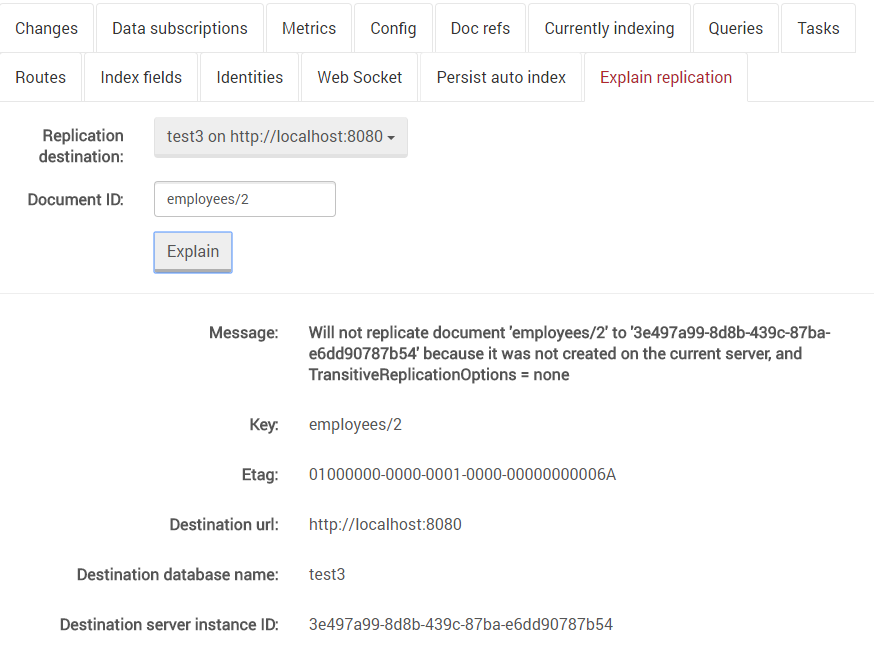
Occasionally we get a user that complains that after setting up replication, some documents aren't being replicated. This is usually by design, because of some configuration or behavior, but getting to the root of it can take a non trivial amount of time.

In order to help that, we added a debug endpoint and a UI screen to handle just that:
Capture

Now you can explicitly ask, why did you skip replication over this document, and RavenDB will run through its logic tree and tell you exactly what the reason is. No more needing to read the logs and find exactly the right message, you can just ask, and get an immediate answer back.

Patch that tells you how much work was done

This wasn't meant to be in this post, as you can see from the title, this is a tiny stupid little feature, but I utterly forgot that we had it, and when I saw it I just loved it.

The premise is very simple, you are running a patch operation against a database, which can take a while. RavenDB will now report to you what the current state of the process is, so you can see that it is progressing easily, and not just wait until you get the "good / no good" message in the end.

image (1)

As a reminder, we have the RavenDB Conference in Texas in shortly, which would be an excellent opportunity to see RavenDB 3.5 in all its glory.

image

time to read 2 min | 326 words

I previously mentioned that a large part of what we need to do as a database is to actively manage our resources, things like CPU usage and memory are relatively easy to manage (to a certain extent), but one of the things that we trip over again and again is the issue of I/O.

Whatever it is a cloud based system with an I/O rate of a an old IBM XT after being picked up from a garage after a flood to users that pack literally hundreds of extremely active database on the same physical storage medium to a user that is reading the entire database (through subscriptions) on every page load, I/O is not something that you can ever have enough of. We spend an incredible amount of time trying to reduce our I/O costs, and still we run into issues.

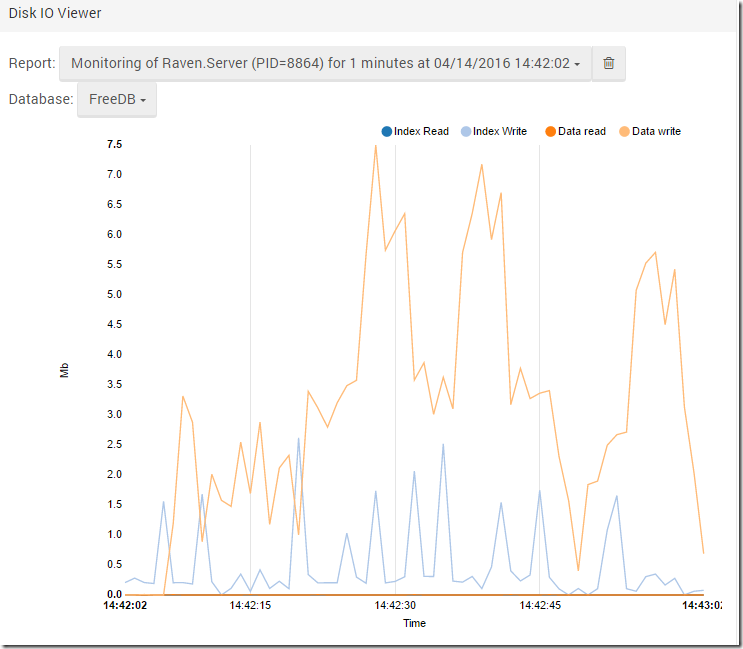
So we decided to approach it from the other side. RavenDB 3.5 now packages Raven.Monitor.exe, which is capable of monitoring the actual I/O and pin point who is to blame, live. Here is what this looks like after 1 minute run in a database that is currently having data imported + some minor indexing.

image

The idea is that we can use this ability to do two things. We can find out who is consuming the I/O on the system, and even narrow down to exactly what is consuming it, but we can also use it to find how much resources a particular database is using, and can tell based on that whatever we are doing good job of utilizing the hardware properly.

As a reminder, we have the RavenDB Conference in Texas in a few months, which would be an excellent opportunity to see RavenDB 3.5 in all its glory.

image

time to read 2 min | 240 words

Another replication feature in RavenDB is the ability to replicate only specific collections to a sibling, and even the ability to transform the outgoing data as it goes out.

Here is an example of how this looks in the UI, which will probably do it much better justice than a thousand words from me.

image

There are several reasons why you'll want to use this feature. In terms of deployment, it gives you an easy way to replicate parts of a database's data to a number of other databases, without requiring you to send the full details. A typical example would be a product catalog that is shared among multiple tenants, but where each tenant can modify the products or add new ones.

Another example would be to have the production database replicate backward to the staging database, with certain fields that are masked so the development / QA team can work with a realistic dataset.

An important consideration with filtered replication is that because the data is filtered, a destination that is using filtered replication isn't a viable fallback target, and it will not be considered as such by the client. If you want failover, you need to have multiple replicas, some with the full data set and some with the filtered data.

time to read 3 min | 443 words

Imagine that you have a two nodes cluster, setup as master-master replication, and then you write a document to one of them. The node you wrote the document to now contacts the 2nd node to let it knows about the new document. The data is replicated, and everything is happy in this world.

But now let us imagine it with three nodes. We write to node 1, which will then replicate to nodes 2 and 3. But node 2 is also configured to replicate to node 3, and given that we have a new document in, it will do just that. Node 3 will detect that it already have this document and turn that into a no-op. But at the same time that node 3 is getting the document from node 2, it is also sending the document it got from node 1 to node 2.

This work, and it evens out eventually, because replicating a document that was already replicated is safe to do. And on high load systems, replication is batched, so you typically don't see a problem until you get to bigger cluster sizes.

Let us take the following six way cluster. In this graph, we are going to have 15 round trips across the network on each replication batch.*

* Nitpicker corner, yes, I know that the number of connections is ( N * (N-1) ) / 2, but N^2 looks better in the title.

mes-topology

The typical answer we have for this is to change the topology, instead of having a fully connected graph, with each node talking to all other nodes, we use something like this:

tree-topology

Real topologies typically have more than a single path, and it isn't a hierarchy, but this is to illustrate a point.

This work, but it requires the operations team to plan ahead when they deploy, and if you didn't allow for breakage, a single node going down can disconnect large portion of your cluster. That is not ideal.

So in RavenDB 3.5 we have taken steps to avoid it, nodes are now much smarter about the way they go about talking about their changes. Instead of getting all fired up and starting to send replication message all over the place, potentially putting some serious pressure on the network, the nodes will be smarter about it, and wait a bit to see if their siblings already got the documents from the same source. In which case, we now only need to ping them periodically to ensure that they are still connected, and we saved a whole bunch of bandwidth.

FUTURE POSTS

  1. Partial writes, IO_Uring and safety - about one day from now
  2. Configuration values & Escape hatches - 5 days from now
  3. What happens when a sparse file allocation fails? - 7 days from now
  4. NTFS has an emergency stash of disk space - 9 days from now
  5. Challenge: Giving file system developer ulcer - 12 days from now

And 4 more posts are pending...

There are posts all the way to Feb 17, 2025

RECENT SERIES

  1. Challenge (77):
    20 Jan 2025 - What does this code do?
  2. Answer (13):
    22 Jan 2025 - What does this code do?
  3. Production post-mortem (2):
    17 Jan 2025 - Inspecting ourselves to death
  4. Performance discovery (2):
    10 Jan 2025 - IOPS vs. IOPS
View all series

Syndication

Main feed Feed Stats
Comments feed   Comments Feed Stats
}