Oren Eini

CEO of RavenDB

a NoSQL Open Source Document Database

Get in touch with me:

oren@ravendb.net +972 52-548-6969

Posts: 7,527
|
Comments: 51,163
Privacy Policy · Terms
filter by tags archive
time to read 2 min | 287 words

We got an interesting question a few times in recent weeks. How can I manually create a document revision with RavenDB? The answer for that is that you can use the ForceRevisionCreationFor() method to do so. Here is how you’ll typically use this API:

This is the typical expected usage for the API. We intended this to make it so users can manually triggers revisions, for example, when moving a document from draft mode to public and the like.

It turns out that there is another reason to want to use this API, when you migrate data to RavenDB and want to create historical revisions. The API we envisioned isn’t suitable for this, but the layered API in RavenDB means that we can still get the desired behavior.

Here is how we can achieve this:

Basically, we manually create the transaction steps that will run on the server, and we can apply the command to the same document multiple times.

Note that RavenDB requires a document to create a revision from it, so we set the document, create a revision and overwrite the document again, as many times as we need to.

Another issue that was brought up is that the @last-modified property on the document is set to the date of the revision creation. In some cases, they want to do this to get the revision to be created at the right time it was originally created during the migration period.

That is not supported by RavenDB, because the @last-modified is tracking the time that RavenDB modified the document or revision. If you need to track the time a document was modified in the domain, you need to keep that as part of your actual domain model.

time to read 1 min | 100 words

Alex has been writing a sample application in RavenDB and has been getting deep into the details of how to architect a non trivial system.

He recently published: Power of Dynamic fields for indexing dictionaries and collections in RavenDB – how to deal with dynamic fields, which joins the previous post:

This makes for an interesting read and walks you through the entire process. There are more in the pipeline…

time to read 3 min | 404 words

Valgrind is an essential tool for anyone who is working with native code, especially if you are running C or C++ code. I have a codebase that is about 15,000 lines of C code, and Valgrind is absolutely essential for me to check my work. It has caught quite a few of my slips.

I recently switched systems and when running the same code using Valgrind, I started to get annoying warnings, like this:

==16896==
--16896-- WARNING: Serious error when reading debug info
--16896-- When reading debug info from /tmp/test.txt:
--16896-- can't read file to inspect ELF header
==16896==

The key issue is that this is, as you can imagine, a data file, why is Valgrind attempting to read ELF details from the file?

It took me a while to narrow things down, but I found that I could reproduce this easily with the following code:

If you’ll run this code with the following command, you should see the warning:

clang a.c && valgrind   ./a.out

Note that this is with clang 10.0.0-4ubuntu1 and valgrind-3.16.1. I decided to check what Valgrind is doing using strace, which gave the following output:

Digging a little deeper, let’s highlight the root cause of this:

openat(AT_FDCWD, "test.txt", O_RDWR|O_CREAT|O_TRUNC|O_DSYNC|O_DIRECT|O_CLOEXEC, 0600) = 3
mmap(0x4a4d000, 262144, PROT_READ, MAP_SHARED|MAP_FIXED, 3, 0) = 0x4a4d000
pread64(3, 0x1002ea98a0, 1024, 0) = -1 EINVAL (Invalid argument)

I’m opening the test.txt file using the O_DIRECT file, which limits the kind of things that you can do with the file. In particular, it means that all access should be on page aligned memory. The pread64() call is not using a page aligned buffer to read from the file.

What is interesting is that my code isn’t issuing any such call, this is coming from inside of Valgrind itself. In particular, I believe that this is the offending piece of code: di_notify_mmap is called whenever we map code, and is complex. The basic issue is that it does not respect the limits of files created with O_DIRECT and that causes the pread() call to fail. At this point, Valgrind outputs the warning.

Brief look at the code indicate that this should be fine. This is a data mapping, not executable mapping, but it still make the attempt. Debugging into Valgrind is beyond the scope of what I want to do. For now, I changed things so any mmap() won’t use the file descriptor with O_DIRECT, and that resolved things for me.

time to read 2 min | 273 words

I’m very happy to announce that the TypeScript / Node.js client API for RavenDB was recently updated to 5.0. This release updates the API to support Time Series API and bulk insert. Beyond the new API and functionality, we have also put a lot of effort into the ergonomics of this release.

One of the major changes that was made was to the way you use indexes in the API. Thanks to Yawar Jamal are due, for suggesting this improvement and sending the initial PR. What does this means? Well, here is an index definition in the new version:

The actual index definition isn’t that interesting. You can see a longer explanation of exactly what I’m doing in this post. What is really interesting is that I can define this using code, no messing about with strings. This is checked by the compiler and is going to give you a similar developer experience as using Linq in .NET.

I also mentioned ergonomics, right? Let’s look at some of the other features that you now get from the client. It’s funny, because this has nothing to do with code execution, but is very important to just Getting Things Done.

Take a look at this:

image (1)

Even though we are passing a string to the query, we have intellisense to assist us and warn about typos.

That applies all over the API, so you don’t really have to make an effort, It Just Works.

image (2)

time to read 3 min | 559 words

I’m very happy to announce that we have recently released version 6.0 of Entity Framework Profiler and NHibernate Profiler. Here are some of the highlights:

image

This new version brings quite a lot to the table. We applied a lot of lessons to optimize the performance of the profiler so it can process events faster and in a more efficient manner. We also fully integrated it with the async/await model that became so popular. For Entity Framework users, we now support all versions of EF, running on .NET 4.7 all the way to .NET 5.0 and anything in between.

What I think is the crown jewels of this release, however, is the new Azure integration feature. We initially built this feature to allow you to profiler serverless code and Azure Functions, but it turned out that this is really useful.

The Profiler Azure Integration allows you to setup a storage container on Azure that would accept the profiled output from your application. Pretty simple, right? The profiler application will monitor the container and show you the events as they are written, so even if you don’t have direct access to profiler the code (very common on serverless / Azure scenarios), you can still profiler your code. That helps a lot as well when talking about running inside containers, Kubernetes, etc. The usual way the profiler and the application communicate is over a TCP channel, but given the myriad of network topologies that are now in common use, this can get complex. By utilizing Azure Integration, we can resolve the whole solution and give you a seamless way to handle profile your code.

On demand profiling of your code is just one part of the new feature. You can now do continuous profiling of your system. Because we throw the events into a blob container in Azure, and given that the data is compressed and cheap to store, you can now afford to simply record all the queries in your application and come back to it a few days or weeks later and look into interesting behaviors.

That is also a large part of why we worked on improving our performance, we expect to be dealing with a lot of data.

You are also able to specify a certain timeframe for this kind of profiling, as well as specify whatever we should remove the data after looking on it or retain it. The new profiling feature gives you a way to answer: “What queries run in production on Monday between 9:17 and 10:22 AM”. This comes with all of the usual benefits of the profiler, meaning that:

  • You can correlate each query to the exact line of code that triggered it.
  • The profiler analyze the database interaction and raise alerts on bad behaviors.

The last part is done not on a single query but with access to the full state of the system. It can allow you to find hot spots in your program, patterns of data access that leads to much higher latency and cost a lot more money.

To celebrate the new release, we are offering the profilers with 20% discount for the new quarter as well as offer a bundling option. You can get the Entity Framework Profiler or the NHibernate Profiler bundled with our Cosmos DB Profiler.

time to read 1 min | 69 words

I’ll be speaking at the Azure Israel group at the end of this month, you can register here:

In this session, Oren Eini will discuss how you can use Azure Cosmos DB in your application. We'll go over data models, proper design, and best practices for building applications using Cosmos DB.
We are going to look into some of the common pitfalls with regards to both performance and cost.

time to read 6 min | 1121 words

RavenDB is a distributed database. You can run it on a single node, in a cluster on a single data center on as a geo distributed cluster. Separately, you can also run RavenDB in a multi master configuration. In this case, you don’t have a single cluster spanning the globe, but multiple cooperating clusters working together. The question is, when should I use a geo distributed cluster and when should I setup a multi master configuration with multiple coordinating clusters?

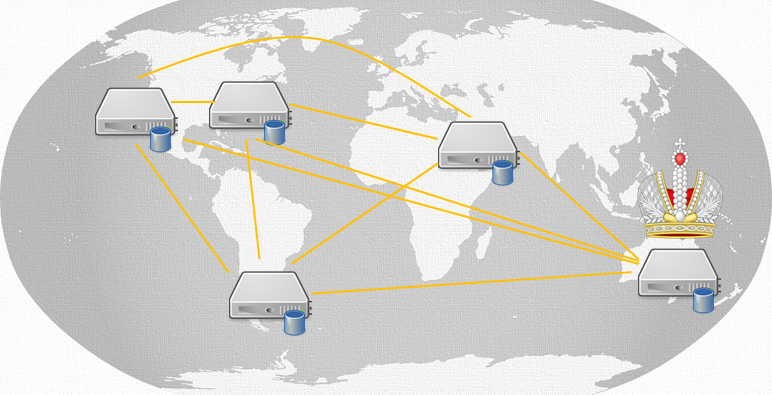
Here is an example of a global cluster:
image

As you can see, we have nodes all over the world, all joined into a single cluster. In this mode, the nodes will select a leader (denoted by the crown) which will manage all the behavior of the cluster. To ensure that we can properly detect failures, we setup a timeout interval that is appropriate for the distances involved.  Note that even in this mode, most of the actual writes to RavenDB will be done on a pure node-local basis and gossiped between the nodes. You can select the appropriate level of write assurance that you want (confirm after it was written to two additional locations, for example).

Such a setup suffer from one issue, coordinating across that distance (and latencies) means that we are need to account for the inherent delay in the decision loop. For most operations, this doesn’t actually impact your system, since most of the work is done in the background and not user visible. It does mean that RavenDB is going to take longer to detect and recover from failures. In the case of the setup in the image, we are talking about the difference between less than 300ms (the default when running in a single data center) to detecting failure in around 5 seconds or so.

Because RavenDB favors availability, it usually doesn’t matter. But there are cases where it does. Any time that you have to wait for a cluster operation, you’ll feel the additional latency. This applies not just to failure detection but when everything is running smoothly. A cluster operation in the above setup will require confirmation from two additional nodes aside from the leader. Ping time in this case would be 200 – 300ms between the nodes, in most cases. That means that at best, any such operation would be completed in 750ms or so.

What operations would this apply to? Creation of new databases and indexes is done as a cluster operation, but they are rarely latency sensitive. The primary issue for this sort of setup is if you are using:

  • Cluster wide transactions
  • Compare exchange operations

In those cases, you have to account for higher latency as part of your overall deployment. Such operations are inherently more expensive. If you are running in a single data center, with ping times that are usually < 1 ms, that is not very noticeable. When you are running in a geo distributed environment, that matters a lot more.

One consideration that we haven’t yet taken into account is what happens during failure. Let’s assume that I have a web application deployed in Brazil, which is aimed at the local RavenDB instance. If the Brazilian’s RavenDB instance decide to visit the carnival and not respond, what is going to happen? On the one hand, the other nodes in the cluster will simply pick up the slack. But for the web application in Brazil, that means that instead of using the local instance, we need to go wide to reach the alternative nodes. GitHub had a similar issue, but between east and west coast and the additional latency inherent in such a setup took them down.

To be honest, beyond the additional latency that you have with cluster wide operations in such a setup, I think that this is the biggest disadvantage of such a system. You can avoid that by running multiple nodes in each location, all joined into a big cluster, of course. Then you can set things up that each client will use the nearest nodes. That gives you local failover, but you still need to consider how to handle total outage in one location.

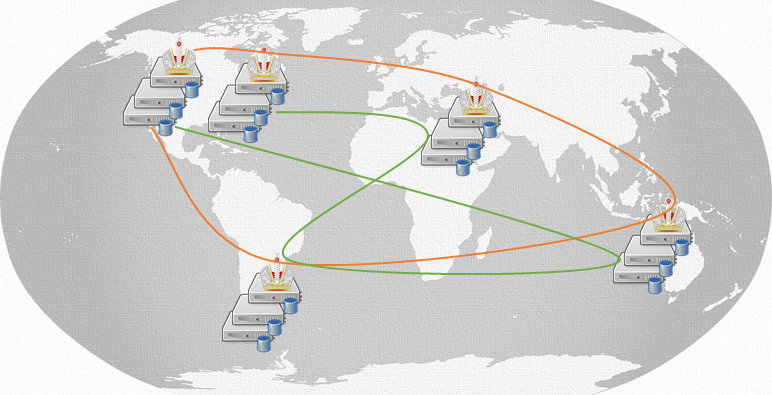
There is another alternative, in which case you have separate clusters in each location (may be a single instance, but I’m showing a cluster there because you’ll want local high availability). Instead of having a single cluster, we set things up so there are multiple such clusters. Then we use RavenDB’s multi-master capabilities to tie them all together.
image

In this setup, the different clusters will gossip between themselves about the data, but that is the only thing that is truly shared. Each cluster will manage its own nodes and failover and work is done only on the local cluster level, not globally.

Other things, indexes, ETL, subscriptions etc are all defined at the cluster level, and you’ll need to consider whatever you’ll have them in each cluster (likely for indexes, for example), or only on a single location. Something like ETL would probably have a designated location that would be pushing the data to its destination, rather than duplicated in each local cluster.

The most interesting question, however, is how do you handle cluster wide transactions or compare exchange operation in such an environment?

A cluster wide transaction is… well, cluster wide. That means that if you have multiple clusters, your consistency scope is only within a single one. That is probably the major limit for breaking apart the cluster in such a system.

There are ways to handle that, of course. You can split your compare exchanges so they will have a particular cluster that will own them, in this manner, you can direct certain operations to a particular cluster regardless of where the operation originated. In many environments, this is already something that will naturally happen. For example, if you are running in such an environment to deal with local clients, it is natural to hold their compare exchange values for the cluster they are using, even if the data is globally replicated.

Another factor to consider is that RavenDB replicates documents  and their data, but compare exchange values aren’t considered in this case. They are global to the cluster, and as such aren’t sent via replication.

I’m afraid that I don’t have one answer to the question how to geo distribute your RavenDB based system. You need to account for several factors about your application, your needs and the system as a whole. But I hope that you’ll now have the appropriate background to make an informed decision.

FUTURE POSTS

No future posts left, oh my!

RECENT SERIES

  1. RavenDB Cloud (2):
    26 Nov 2024 - Auto scaling
  2. Challenge (75):
    01 Jul 2024 - Efficient snapshotable state
  3. Recording (14):
    19 Jun 2024 - Building a Database Engine in C# & .NET
  4. re (33):
    28 May 2024 - Secure Drop protocol
  5. Meta Blog (2):
    23 Jan 2024 - I'm a JS Developer now
View all series

Syndication

Main feed Feed Stats
Comments feed   Comments Feed Stats
}