The following bug cost me a bunch of time, can you see what I’m doing wrong?
For fun, it’s so nasty because usually, it will accidentally work.
The following bug cost me a bunch of time, can you see what I’m doing wrong?
For fun, it’s so nasty because usually, it will accidentally work.
In the previous post, I was able to utilize AVX to get some nice speedups. In general, I was able to save up to 57%(!) of the runtime in processing arrays of 1M items. That is really amazing, if you think about it. But my best effort only gave me a 4% improvement when using 32M items.
I decided to investigate what is going on in more depth, and I came up with the following benchmark. Given that I want to filter negative numbers, what would happen if the only negative number in the array was the first one?
In other words, let’s see what happens when we could write this algorithm as the following line of code:
array[1..].CopyTo(array);
The idea here is that we should measure the speed of raw memory copy and see how that compares to our code.
Before we dive into the results, I want to make a few things explicit. We are dealing here with arrays of long, when I’m talking about an array with 1M items, I’m actually talking about an 8MB buffer, and for the 32M items, we are talking about 256MB of memory.
I’m running these benchmarks on the following machine:
AMD Ryzen 9 5950X 16-Core Processor
Base speed: 3.40 GHz
L1 cache: 1.0 MB
L2 cache: 8.0 MB
L3 cache: 64.0 MBUtilization 9%
Speed 4.59 GHz
In other words, when we look at this, the 1M items (8MB) can fit into L2 (barely, but certainly backed by the L3 cache. For the 32M items (256MB), we are far beyond what can fit in the cache, so we are probably dealing with memory bandwidth issues.
I wrote the following functions to test it out:
Let’s look at what I’m actually testing here.
Here are the results for the 1M case (8MB):
Method | N | Mean | Error | StdDev | Ratio |
---|---|---|---|---|---|
FilterCmp | 1048599 | 441.4 us | 1.78 us | 1.58 us | 1.00 |
FilterCmp_Avx | 1048599 | 141.1 us | 2.70 us | 2.65 us | 0.32 |
CopyTo | 1048599 | 872.8 us | 11.27 us | 10.54 us | 1.98 |
MemoryCopy | 1048599 | 869.7 us | 7.29 us | 6.46 us | 1.97 |
MoveMemory | 1048599 | 126.9 us | 0.28 us | 0.25 us | 0.29 |
We can see some real surprises here. I’m using the FilterCmp (the very basic implementation) that I wrote.
I cannot explain why CopyTo() and MemoryMove() are so slow.
What is really impressive is that the FilterCmp_Avx() and MoveMemory() are so close in performance, and so much faster. To put it in another way, we are already at a stage where we are within shouting distance from the MoveMemory() performance. That is.. really impressive.
That said, what happens with 32M (256MB) ?
Method | N | Mean | Error | StdDev | Ratio |
---|---|---|---|---|---|
FilterCmp | 33554455 | 22,763.6 us | 157.23 us | 147.07 us | 1.00 |
FilterCmp_Avx | 33554455 | 20,122.3 us | 214.10 us | 200.27 us | 0.88 |
CopyTo | 33554455 | 27,660.1 us | 91.41 us | 76.33 us | 1.22 |
MemoryCopy | 33554455 | 27,618.4 us | 136.16 us | 127.36 us | 1.21 |
MoveMemory | 33554455 | 20,152.0 us | 166.66 us | 155.89 us | 0.89 |
Now we are faster in the FilterCmp_Avx than MoveMemory. That is… a pretty big wow, and a really nice close for this blog post series, right? Except that we won’t be stopping here.
The way the task I set out works, we are actually filtering just the first item out, and then we are basically copying the memory. Let’s do some math: 256MB in 20.1ms means 12.4 GB/sec!
On this system, I have the following memory setup:
64.0 GB
Speed: 2133 MHz
Slots used: 4 of 4
Form factor: DIMM
Hardware reserved: 55.2 MB
I’m using DDR4 memory, so I can expect a maximum speed of 17GB/sec. In theory, I might be able to get more if the memory is located on different DIMMs, but for the size in question, that is not likely.
I’m going to skip the training montage of VTune, understanding memory architecture and figuring out what is actually going on.
Let’s drop everything and look at what we have with just AVX vs. MoveMemory:
Method | N | Mean | Error | StdDev | Median | Ratio |
---|---|---|---|---|---|---|
FilterCmp_Avx | 1048599 | 141.6 us | 2.28 us | 2.02 us | 141.8 us | 1.12 |
MoveMemory | 1048599 | 126.8 us | 0.25 us | 0.19 us | 126.8 us | 1.00 |
FilterCmp_Avx | 33554455 | 21,105.5 us | 408.65 us | 963.25 us | 20,770.4 us | 1.08 |
MoveMemory | 33554455 | 20,142.5 us | 245.08 us | 204.66 us | 20,108.2 us | 1.00 |
The new baseline is MoveMemory, and in this run, we can see that the AVX code is slightly slower.
It’s sadly not uncommon to see numbers shift by those ranges when we are testing such micro-optimizations, mostly because we are subject to so many variables that can affect performance. In this case, I dropped all the other benchmarks, which may have changed things.
At any rate, using those numbers, we have 12.4GB/sec for MoveMemory() and 11.8GB/sec for the AVX version. The hardware maximum speed is 17GB/sec. So we are quite close to what can be done.
For that matter, I would like to point out that the trivial code completed the task in 11GB/sec, so that is quite respectable and shows that the issue here is literally getting the memory fast enough to the CPU.
Can we do something about that? I made a pretty small change to the AVX version, like so:
What are we actually doing here? Instead of loading the value and immediately using it, we are loading the next value, then we are executing the loop and when we iterate again, we will start loading the next value and process the current one. The idea is to parallelize load and compute at the instruction level.
Sadly, that didn’t seem to do the trick. I saw a 19% additional cost for that version compared to the vanilla AVX one on the 8MB run and a 2% additional cost on the 256MB run.
I then realized that there was one really important test that I had to also make, and wrote the following:
In other words, let's test the speed of moving memory and filling memory as fast as we possibly can. Here are the results:
Method | N | Mean | Error | StdDev | Ratio | RatioSD | Code Size |
---|---|---|---|---|---|---|---|
MoveMemory | 1048599 | 126.8 us | 0.36 us | 0.33 us | 0.25 | 0.00 | 270 B |
FillMemory | 1048599 | 513.5 us | 10.05 us | 10.32 us | 1.00 | 0.00 | 351 B |
MoveMemory | 33554455 | 20,022.5 us | 395.35 us | 500.00 us | 1.26 | 0.02 | 270 B |
FillMemory | 33554455 | 15,822.4 us | 19.85 us | 17.60 us | 1.00 | 0.00 | 351 B |
This is really interesting, for a small buffer (8MB), MoveMemory is somehow faster. I don’t have a way to explain that, but it has been a pretty consistent result in my tests.
For the large buffer (256MB), we are seeing results that make more sense to me.
In other words, for MoveMemory, we are both reading and writing, so we are paying for memory bandwidth in both directions. For filling the memory, we are only writing, so we can get better performance (no need for reads).
In other words, we are talking about hitting the real physical limits of what the hardware can do. There are all sorts of tricks that one can pull, but when we are this close to the limit, they are almost always context-sensitive and dependent on many factors.
To conclude, here are my final results:
Method | N | Mean | Error | StdDev | Ratio | RatioSD | Code Size |
---|---|---|---|---|---|---|---|
FilterCmp_Avx | 1048599 | 307.9 us | 6.15 us | 12.84 us | 0.99 | 0.05 | 270 B |
FilterCmp_Avx_Next | 1048599 | 308.4 us | 6.07 us | 9.26 us | 0.99 | 0.03 | 270 B |
CopyTo | 1048599 | 1,043.7 us | 15.96 us | 14.93 us | 3.37 | 0.11 | 452 B |
ArrayCopy | 1048599 | 1,046.7 us | 15.92 us | 14.89 us | 3.38 | 0.14 | 266 B |
UnsafeCopy | 1048599 | 309.5 us | 6.15 us | 8.83 us | 1.00 | 0.04 | 133 B |
MoveMemory | 1048599 | 310.8 us | 6.17 us | 9.43 us | 1.00 | 0.00 | 270 B |
FilterCmp_Avx | 33554455 | 24,013.1 us | 451.09 us | 443.03 us | 0.98 | 0.02 | 270 B |
FilterCmp_Avx_Next | 33554455 | 24,437.8 us | 179.88 us | 168.26 us | 1.00 | 0.01 | 270 B |
CopyTo | 33554455 | 32,931.6 us | 416.57 us | 389.66 us | 1.35 | 0.02 | 452 B |
ArrayCopy | 33554455 | 32,538.0 us | 463.00 us | 433.09 us | 1.33 | 0.02 | 266 B |
UnsafeCopy | 33554455 | 24,386.9 us | 209.98 us | 196.42 us | 1.00 | 0.01 | 133 B |
MoveMemory | 33554455 | 24,427.8 us | 293.75 us | 274.78 us | 1.00 | 0.00 | 270 B |
As you can see, just the AVX version is comparable or (slightly) beating the MoveMemory function.
I tried things like prefetching memory, both the next item, the next cache item and from the next page, using non-temporal load and stores and many other things, but this is a pretty tough challenge.
What is really interesting is that the original, very simple and obvious implementation, clocked at 11 GB/sec. After pulling pretty much all the stops and tricks, I was able to hit 12.5 GB / sec.
I don’t think anyone can look / update / understand the resulting code in any way without going through deep meditation. That is not a bad result at all. And along the way, I learned quite a bit about how the lowest level of the machine architecture is working.
In the previous post I discussed how we can optimize the filtering of negative numbers by unrolling the loop, looked into branchless code and in general was able to improve performance by up to 15% from the initial version we started with. We pushed as much as we could on what can be done using scalar code. Now it is the time to open a whole new world and see what we can do when we implement this challenge using vector instructions.
The key problem with such tasks is that SIMD, AVX and their friends were designed by… an interesting process using a perspective that makes sense if you can see in a couple of additional dimensions. I assume that at least some of that is implementation constraints, but the key issue is that when you start using SIMD, you realize that you don’t have general-purpose instructions. Instead, you have a lot of dedicated instructions that are doing one thing, hopefully well, and it is your role to compose them into something that would make sense. Oftentimes, you need to turn the solution on its head in order to successfully solve it using SIMD. The benefit, of course, is that you can get quite an amazing boost in speed when you do this.
The algorithm we use is basically to scan the list of entries and copy to the start of the list only those items that are positive. How can we do that using SIMD? The whole point here is that we want to be able to operate on multiple data, but this particular task isn’t trivial. I’m going to show the code first, then discuss what it does in detail:
We start with the usual check (if you’ll recall, that ensures that the JIT knows to elide some range checks, then we load the PremuteTable. For now, just assume that this is magic (and it is). The first interesting thing happens when we start iterating over the loop. Unlike before, now we do that in chunks of 4 int64 elements at a time. Inside the loop, we start by loading a vector of int64 and then we do the first odd thing. We call ExtractMostSignificantBits(), since the sign bit is used to mark whether a number if negative or not. That means that I can use a single instruction to get an integer with the bits set for all the negative numbers. That is particularly juicy for what we need, since there is no need for comparisons, etc.
If the mask we got is all zeroes, it means that all the numbers we loaded to the vector are positives, so we can write them as-is to the output and move to the next part. Things get interesting when that isn’t the case.
We load a permute value using some shenanigans (we’ll touch on that shortly) and call the PermuteVar8x32() method. The idea here is that we pack all the non-negative numbers to the start of the vector, then we write the vector to the output. The key here is that when we do that, we increment the output index only by the number of valid values. The rest of this method just handles the remainder that does not fit into a vector.
The hard part in this implementation was to figure out how to handle the scenario where we loaded some negative numbers. We need a way to filter them, after all. But there is no SIMD instruction that allows us to do so. Luckily, we have the Avx2.PermuteVar8x32() method to help here. To confuse things, we don’t actually want to deal with 8x32 values. We want to deal with 4x64 values. There is Avx2.Permute4x64() method, and it will work quite nicely, with a single caveat. This method assumes that you are going to pass it a constant value. We don’t have such a constant, we need to be able to provide that based on whatever the masked bits will give us.
So how do we deal with this issue of filtering with SIMD? We need to move all the values we care about to the front of the vector. We have the method to do that, PermuteVar8x32() method, and we just need to figure out how to actually make use of this. PermuteVar8x32() accepts an input vector as well as a vector of the premutation you want to make. In this case, we are basing this on the 4 top bits of the 4 elements vector of int64. As such, there are a total of 16 options available to us. We have to deal with 32bits values rather than 64bits, but that isn’t that much of a problem.
Here is the premutation table that we’ll be using:
What you can see here is that when we have a 1 in the bits (shown in comments) we’ll not copy that to the vector. Let’s take a look at the entry of 0101, which may be caused by the following values [1,-2,3,-4].
When we look at the right entry at index #5 in the table: 2,3,6,7,0,0,0,0
What does this mean? It means that we want to put the 2nd int64 element in the source vector and move it as the first element of the destination vector, take the 3rd element from the source as the second element in the destination and discard the rest (marked as 0,0,0,0 in the table).
This is a bit hard to follow because we have to compose the value out of the individual 32 bits words, but it works quite well. Or, at least, it would work, but not as efficiently. This is because we would need to load the PermuteTableInts into a variable and access it, but there are better ways to deal with it. We can also ask the JIT to embed the value directly. The problem is that the pattern that the JIT recognizes is limited to ReadOnlySpan<byte>, which means that the already non-trivial int32 table got turned into this:
This is the exact same data as before, but using ReadOnlySpan<byte> means that the JIT can package that inside the data section and treat it as a constant value.
The code was heavily optimized, to the point where I noticed a JIT bug where these two versions of the code give different assembly output:
Here is what we get out:
This looks like an unintended consequence of Roslyn and the JIT each doing their (separate jobs), but not reaching the end goal. Constant folding looks like it is done mostly by Roslyn, but it does a scan like that from the left, so it wouldn’t convert $A * 4 * 8 to $A * 32. That is because it stopped evaluating the constants when it found a variable. When we add parenthesis, we isolate the value and now understand that we can fold it.
Speaking of assembly, here is the annotated assembly version of the code:
And after all of this work, where are we standing?
Method | N | Mean | Error | StdDev | Ratio | RatioSD | Code Size |
---|---|---|---|---|---|---|---|
FilterCmp | 23 | 285.7 ns | 3.84 ns | 3.59 ns | 1.00 | 0.00 | 411 B |
FilterCmp_NoRangeCheck | 23 | 272.6 ns | 3.98 ns | 3.53 ns | 0.95 | 0.01 | 397 B |
FilterCmp_Unroll_8 | 23 | 261.4 ns | 1.27 ns | 1.18 ns | 0.91 | 0.01 | 672 B |
FilterCmp_Avx | 23 | 261.6 ns | 1.37 ns | 1.28 ns | 0.92 | 0.01 | 521 B |
FilterCmp | 1047 | 758.7 ns | 1.51 ns | 1.42 ns | 1.00 | 0.00 | 411 B |
FilterCmp_NoRangeCheck | 1047 | 756.8 ns | 1.83 ns | 1.53 ns | 1.00 | 0.00 | 397 B |
FilterCmp_Unroll_8 | 1047 | 640.4 ns | 1.94 ns | 1.82 ns | 0.84 | 0.00 | 672 B |
FilterCmp_Avx | 1047 | 426.0 ns | 1.62 ns | 1.52 ns | 0.56 | 0.00 | 521 B |
FilterCmp | 1048599 | 502,681.4 ns | 3,732.37 ns | 3,491.26 ns | 1.00 | 0.00 | 411 B |
FilterCmp_NoRangeCheck | 1048599 | 499,472.7 ns | 6,082.44 ns | 5,689.52 ns | 0.99 | 0.01 | 397 B |
FilterCmp_Unroll_8 | 1048599 | 425,800.3 ns | 352.45 ns | 312.44 ns | 0.85 | 0.01 | 672 B |
FilterCmp_Avx | 1048599 | 218,075.1 ns | 212.40 ns | 188.29 ns | 0.43 | 0.00 | 521 B |
FilterCmp | 33554455 | 29,820,978.8 ns | 73,461.68 ns | 61,343.83 ns | 1.00 | 0.00 | 411 B |
FilterCmp_NoRangeCheck | 33554455 | 29,471,229.2 ns | 73,805.56 ns | 69,037.77 ns | 0.99 | 0.00 | 397 B |
FilterCmp_Unroll_8 | 33554455 | 29,234,413.8 ns | 67,597.45 ns | 63,230.70 ns | 0.98 | 0.00 | 672 B |
FilterCmp_Avx | 33554455 | 28,498,115.4 ns | 71,661.94 ns | 67,032.62 ns | 0.96 | 0.00 | 521 B |
So it seems that the idea of using SIMD instruction has a lot of merit. Moving from the original code to the final version, we see that we can complete the same task in up to half the time.
I’m not quite sure why we aren’t seeing the same sort of performance on the 32M, but I suspect that this is likely because we far exceed the CPU cache and we have to fetch it all from memory, so that is as fast as it can go.
If you are interested in learning more, Lemire solves the same problem in SVE (SIMD for ARM) and Paul has a similar approach in Rust.
If you can think of further optimizations, I would love to hear your ideas.
In the previous post, we looked into what it would take to reduce the cost of filtering negative numbers. We got into the assembly and analyzed exactly what was going on. In terms of this directly, I don’t think that even hand-optimized assembly would take us further. Let’s see if there are other options that are available for us to get better speed.
The first thing that pops to mind here is to do a loop unrolling. After all, we have a very tight loop, if we can do more work per loop iteration, we might get better performance, no? Here is my first version:
And here are the benchmark results:
Method | N | Mean | Error | StdDev | Ratio | Code Size |
---|---|---|---|---|---|---|
FilterCmp | 23 | 274.6 ns | 0.40 ns | 0.35 ns | 1.00 | 411 B |
FilterCmp_Unroll | 23 | 257.5 ns | 0.94 ns | 0.83 ns | 0.94 | 606 B |
FilterCmp | 1047 | 748.1 ns | 2.91 ns | 2.58 ns | 1.00 | 411 B |
FilterCmp_Unroll | 1047 | 702.5 ns | 5.23 ns | 4.89 ns | 0.94 | 606 B |
FilterCmp | 1048599 | 501,545.2 ns | 4,985.42 ns | 4,419.45 ns | 1.00 | 411 B |
FilterCmp_Unroll | 1048599 | 446,311.1 ns | 3,131.42 ns | 2,929.14 ns | 0.89 | 606 B |
FilterCmp | 33554455 | 29,637,052.2 ns | 184,796.17 ns | 163,817.00 ns | 1.00 | 411 B |
FilterCmp_Unroll | 33554455 | 29,275,060.6 ns | 145,756.53 ns | 121,713.31 ns | 0.99 | 606 B |
That is quite a jump, 6% – 11% savings is no joke. Let’s look at what is actually going on at the assembly level and see if we can optimize this further.
As expected, the code size is bigger, 264 bytes versus the 55 we previously got. But more importantly, we got the range check back, and a lot of them:
The JIT isn’t able to reason about our first for loop and see that all our accesses are within bounds, which leads to doing a lot of range checks, and likely slows us down. Even with that, we are still showing significant improvements here.
Let’s see what we can do with this:
With that, we expect to have no range checks and still be able to benefit from the unrolling.
Method | N | Mean | Error | StdDev | Ratio | RatioSD | Code Size |
---|---|---|---|---|---|---|---|
FilterCmp | 23 | 275.4 ns | 2.31 ns | 2.05 ns | 1.00 | 0.00 | 411 B |
FilterCmp_Unroll | 23 | 253.6 ns | 2.59 ns | 2.42 ns | 0.92 | 0.01 | 563 B |
FilterCmp | 1047 | 741.6 ns | 5.95 ns | 5.28 ns | 1.00 | 0.00 | 411 B |
FilterCmp_Unroll | 1047 | 665.5 ns | 2.38 ns | 2.22 ns | 0.90 | 0.01 | 563 B |
FilterCmp | 1048599 | 497,624.9 ns | 3,904.39 ns | 3,652.17 ns | 1.00 | 0.00 | 411 B |
FilterCmp_Unroll | 1048599 | 444,489.0 ns | 2,524.45 ns | 2,361.38 ns | 0.89 | 0.01 | 563 B |
FilterCmp | 33554455 | 29,781,164.3 ns | 361,625.63 ns | 320,571.70 ns | 1.00 | 0.00 | 411 B |
FilterCmp_Unroll | 33554455 | 29,954,093.9 ns | 588,614.32 ns | 916,401.59 ns | 1.01 | 0.04 | 563 B |
That helped, by quite a lot, it seems, for most cases, the 32M items case, however, was slightly slower, which is quite a surprise.
Looking at the assembly, I can see that we still have branches, like so:
And here is why this is the case:
Now, can we do better here? It turns out that we can, by using a branchless version of the operation. Here is another way to write the same thing:
What happens here is that we are unconditionally setting the value in the array, but only increment if the value is greater than or equal to zero. That saves us in branches and will likely result in less code. In fact, let’s see what sort of assembly the JIT will output:
What about the performance? I decided to pit the two versions (normal and branchless) head to head and see what this will give us:
Method | N | Mean | Error | StdDev | Ratio | Code Size |
---|---|---|---|---|---|---|
FilterCmp_Unroll | 23 | 276.3 ns | 4.13 ns | 3.86 ns | 1.00 | 411 B |
FilterCmp_Unroll_Branchleses | 23 | 263.6 ns | 0.95 ns | 0.84 ns | 0.96 | 547 B |
FilterCmp_Unroll | 1047 | 743.7 ns | 9.41 ns | 8.80 ns | 1.00 | 411 B |
FilterCmp_Unroll_Branchleses | 1047 | 733.3 ns | 3.54 ns | 3.31 ns | 0.99 | 547 B |
FilterCmp_Unroll | 1048599 | 502,631.1 ns | 3,641.47 ns | 3,406.23 ns | 1.00 | 411 B |
FilterCmp_Unroll_Branchleses | 1048599 | 495,590.9 ns | 335.33 ns | 297.26 ns | 0.99 | 547 B |
FilterCmp_Unroll | 33554455 | 29,356,331.7 ns | 207,133.86 ns | 172,966.15 ns | 1.00 | 411 B |
FilterCmp_Unroll_Branchleses | 33554455 | 29,709,835.1 ns | 86,129.58 ns | 71,922.10 ns | 1.01 | 547 B |
Surprisingly enough, it looks like the branchless version is very slightly slower. That is a surprise, since I would expect reducing the branches to be more efficient.
Looking at the assembly of those two, the branchless version is slightly bigger (10 bytes, not that meaningful). I think that the key here is that there is a 0.5% chance of actually hitting the branch, which is pretty low. That means that the branch predictor can likely do a really good job and we aren’t going to see any big benefits from the branchless version.
That said… what would happen if we tested that with 5% negatives? That difference in behavior may cause us to see a different result. I tried that, and the results were quite surprising. In the case of the 1K and 32M items, we see a slightl cost for the branchless version (additional 1% – 4%) while for the 1M entries there is an 18% reduction in latency for the branchless version.
I ran the tests again with a 15% change of negative, to see what would happen. In that case, we get:
Method | N | Mean | Error | StdDev | Ratio | RatioSD | Code Size |
---|---|---|---|---|---|---|---|
FilterCmp_Unroll | 23 | 273.5 ns | 3.66 ns | 3.42 ns | 1.00 | 0.00 | 537 B |
FilterCmp_Unroll_Branchleses | 23 | 280.2 ns | 4.85 ns | 4.30 ns | 1.03 | 0.02 | 547 B |
FilterCmp_Unroll | 1047 | 1,675.7 ns | 29.55 ns | 27.64 ns | 1.00 | 0.00 | 537 B |
FilterCmp_Unroll_Branchleses | 1047 | 1,676.3 ns | 16.97 ns | 14.17 ns | 1.00 | 0.02 | 547 B |
FilterCmp_Unroll | 1048599 | 2,206,354.4 ns | 6,141.19 ns | 5,444.01 ns | 1.00 | 0.00 | 537 B |
FilterCmp_Unroll_Branchleses | 1048599 | 1,688,677.3 ns | 11,584.00 ns | 10,835.68 ns | 0.77 | 0.01 | 547 B |
FilterCmp_Unroll | 33554455 | 205,320,736.1 ns | 2,757,108.01 ns | 2,152,568.58 ns | 1.00 | 0.00 | 537 B |
FilterCmp_Unroll_Branchleses | 33554455 | 199,520,169.4 ns | 2,097,285.87 ns | 1,637,422.86 ns | 0.97 | 0.01 | 547 B |
As you can see, we have basically the same cost under 15% negatives for small values, a big improvement on the 1M scenario and not much improvement on the 32M scenario.
All in all, that is very interesting information. Digging into the exact why and how of that means pulling a CPU instruction profiler and starting to look at where we have stalls, which is a bit further that I want to invest in this scenario.
What if we’ll try to rearrange the code a little bit. The code looks like this (load the value and AddToOutput() immediately):
AddToOutput(ref itemsRef, Unsafe.Add(ref itemsRef, i + 0));
What if we split it a little bit, so the code will look like this:
The idea here is that we are trying to get the JIT / CPU to fetch the items before they are actually needed, so there would be more time for the memory to arrive.
Remember that for the 1M scenario, we are dealing with 8MB of memory and for the 32M scenario, we have 256MB. Here is what happens when we look at the loop prolog, we can see that it is indeed first fetching all the items from memory, then doing the work:
In terms of performance, that gives us a small win (1% – 2% range) for the 1M and 32M entries scenario.
The one last thing that I wanted to test is if we’ll unroll the loop even further, what would happen if we did 8 items per loop, instead of 4.
There is some improvement, (4% in the 1K scenario, 1% in the 32M scenario) but also slowdowns (2% in the 1M scenario).
I think that this is probably roughly the end of the line as far as we can get for scalar code.
We already made quite a few strides in trying to parallelize the work the CPU is doing by just laying out the code as we would like it to be. We tried to control the manner in which it touches memory and in general, those are pretty advanced techniques.
To close this post, I would like to take a look at the gains we got. I’m comparing the first version of the code, the last version we had on the previous post and the unrolled version for both branchy and branchless with 8 operations at once and memory prefetching.
Method | N | Mean | Error | StdDev | Ratio | RatioSD | Code Size |
---|---|---|---|---|---|---|---|
FilterCmp | 23 | 277.3 ns | 0.69 ns | 0.64 ns | 1.00 | 0.00 | 411 B |
FilterCmp_NoRangeCheck | 23 | 270.7 ns | 0.42 ns | 0.38 ns | 0.98 | 0.00 | 397 B |
FilterCmp_Unroll_8 | 23 | 257.6 ns | 1.45 ns | 1.21 ns | 0.93 | 0.00 | 672 B |
FilterCmp_Unroll_8_Branchless | 23 | 259.9 ns | 1.96 ns | 1.84 ns | 0.94 | 0.01 | 682 B |
FilterCmp | 1047 | 754.3 ns | 1.38 ns | 1.22 ns | 1.00 | 0.00 | 411 B |
FilterCmp_NoRangeCheck | 1047 | 749.0 ns | 1.81 ns | 1.69 ns | 0.99 | 0.00 | 397 B |
FilterCmp_Unroll_8 | 1047 | 647.2 ns | 2.23 ns | 2.09 ns | 0.86 | 0.00 | 672 B |
FilterCmp_Unroll_8_Branchless | 1047 | 721.2 ns | 1.23 ns | 1.09 ns | 0.96 | 0.00 | 682 B |
FilterCmp | 1048599 | 499,675.6 ns | 2,639.97 ns | 2,469.43 ns | 1.00 | 0.00 | 411 B |
FilterCmp_NoRangeCheck | 1048599 | 494,388.4 ns | 600.46 ns | 532.29 ns | 0.99 | 0.01 | 397 B |
FilterCmp_Unroll_8 | 1048599 | 426,940.7 ns | 1,858.57 ns | 1,551.99 ns | 0.85 | 0.01 | 672 B |
FilterCmp_Unroll_8_Branchless | 1048599 | 483,940.8 ns | 517.14 ns | 458.43 ns | 0.97 | 0.00 | 682 B |
FilterCmp | 33554455 | 30,282,334.8 ns | 599,306.15 ns | 531,269.30 ns | 1.00 | 0.00 | 411 B |
FilterCmp_NoRangeCheck | 33554455 | 29,410,612.5 ns | 29,583.56 ns | 24,703.61 ns | 0.97 | 0.02 | 397 B |
FilterCmp_Unroll_8 | 33554455 | 29,102,708.3 ns | 42,824.78 ns | 40,058.32 ns | 0.96 | 0.02 | 672 B |
FilterCmp_Unroll_8_Branchless | 33554455 | 29,761,841.1 ns | 48,108.03 ns | 42,646.51 ns | 0.98 | 0.02 | 682 B |
The unrolled 8 version is the winner by far, in this scenario (0.5% negatives). Since that is the scenario we have in the real code, that is what I’m focusing on.
Is there anything left to do here?
My next step is to explore whether using vector instructions will be a good option for us.
While working deep on the guts of RavenDB, I found myself with a seemingly simple task. Given a list of longs, I need to filter out all negative numbers as quickly as possible.
The actual scenario is that we run a speculative algorithm, given a potentially large list of items, we check if we can fulfill the request in an optimal fashion. However, if that isn’t possible, we need to switch to a slower code path that does more work.
Conceptually, this looks something like this:
That is the setup for this story. The problem we have now is that we now need to filter the results we pass to the RunManually() method.
There is a problem here, however. We marked the entries that we already used in the list by negating them. The issue is that RunManually() does not allow negative values, and its internal implementation is not friendly to ignoring those values.
In other words, given a Span<long>, I need to write the code that would filter out all the negative numbers. Everything else about the list of numbers should remain the same (the order of elements, etc).
From a coding perspective, this is as simple as:
Please note, just looking at this code makes me cringe a lot. This does the work, but it has an absolutely horrible performance profile. It allocates multiple arrays, uses a lambda, etc.
We don’t actually care about the entries here, so we are free to modify them without allocating a new value. As such, let’s see what kind of code we can write to do this work in an efficient manner. Here is what I came up with:
The way this works is that we scan through the list, skipping writing the negative lists, so we effectively “move down” all the non-negative lists on top of the negative ones. This has a cost of O(N) and will modify the entire array, the final output is the number of valid items that we have there.
In order to test the performance, I wrote the following harness:
We compare 1K, 1M and 32M elements arrays, each of which has about 0.5% negative, randomly spread across the range. Because we modify the values directly, we need to sprinkle the negatives across the array on each call. In this case, I’m testing two options for this task, one that uses a direct comparison (shown above) and one that uses bitwise or, like so:
I’m testing the cost of sprinkling negatives as well, since that has to be done before each benchmark call (since we modify the array during the call, we need to “reset” its state for the next one).
Given the two options, before we discuss the results, what would you expect to be the faster option? How would the size of the array matter here?
I really like this example, because it is simple, there isn’t any real complexity in what we are trying to do. And there is a very straightforward implementation that we can use as our baseline. That also means that I get to analyze what is going on at a very deep level. You might have noticed the disassembler attribute on the benchmark code, we are going to dive deep into that. For the same reason, we aren’t using exactly 1K, 1M, or 32M arrays, but slightly higher than that, so we’ll have to deal with remainders later on.
Let’s first look at what the JIT actually did here. Here is the annotated assembly for the FilterCmp function:
For the FilterOr, the code is pretty much the same, except that the key part is:
As you can see, the cmp option is slightly smaller, in terms of code size. In terms of performance, we have:
Method | N | Mean |
---|---|---|
FilterOr | 1047 | 745.6 ns |
FilterCmp | 1047 | 745.8 ns |
— | – | – |
FilterOr | 1048599 | 497,463.6 ns |
FilterCmp | 1048599 | 498,784.8 ns |
— | – | – |
FilterOr | 33554455 | 31,427,660.7 ns |
FilterCmp | 33554455 | 30,024,102.9 ns |
The costs are very close to one another, with Or being very slightly faster on low numbers, and Cmp being slightly faster on the larger sizes. Note that the difference level between them is basically noise. They have the same performance.
The question is, can we do better here?
Looking at the assembly, there is an extra range check in the main loop that the JIT couldn’t elide (the call to items[output++]). Can we do something about it, and would it make any difference in performance? Here is how I can remove the range check:
Here I’m telling the JIT: “I know what I’m doing”, and it shows.
Let’s look at the assembly changes between those two methods, first the prolog:
Here you can see what we are actually doing here. Note the last 4 instructions, we have a range check for the items, and then we have another check for the loop. The first will get you an exception, the second will just skip the loop. In both cases, we test the exact same thing. The JIT had a chance to actually optimize that, but didn’t.
Here is a funny scenario where adding code may reduce the amount of code generated. Let’s do another version of this method:
In this case, I added a check to handle the scenario of items being empty. What can the JIT do with this now? It turns out, quite a lot. We dropped 10 bytes from the method, which is a nice result of our diet. Here is the annotated version of the assembly:
A lot of the space savings in this case come from just not having to do a range check, but you’ll note that we still do an extra check there (lines 12..13), even though we already checked that. I think that the JIT knows that the value is not zero at this point, but has to consider that the value may be negative.
If we’ll change the initial guard clause to: items.Length <= 0, what do you think will happen? At this point, the JIT is smart enough to just elide everything, we are at 55 bytes of code and it is a super clean assembly (not a sentence I ever thought I would use). I’ll spare you going through more assembly listing, but you can find the output here.
And after all of that, where are we at?
Method | N | Mean | Error | StdDev | Ratio | RatioSD | Code Size |
---|---|---|---|---|---|---|---|
FilterCmp | 23 | 274.5 ns | 1.91 ns | 1.70 ns | 1.00 | 0.00 | 411 B |
FilterCmp_NoRangeCheck | 23 | 269.7 ns | 1.33 ns | 1.24 ns | 0.98 | 0.01 | 397 B |
FilterCmp | 1047 | 744.5 ns | 4.88 ns | 4.33 ns | 1.00 | 0.00 | 411 B |
FilterCmp_NoRangeCheck | 1047 | 745.8 ns | 3.44 ns | 3.22 ns | 1.00 | 0.00 | 397 B |
FilterCmp | 1048599 | 502,608.6 ns | 3,890.38 ns | 3,639.06 ns | 1.00 | 0.00 | 411 B |
FilterCmp_NoRangeCheck | 1048599 | 490,669.1 ns | 1,793.52 ns | 1,589.91 ns | 0.98 | 0.01 | 397 B |
FilterCmp | 33554455 | 30,495,286.6 ns | 602,907.86 ns | 717,718.92 ns | 1.00 | 0.00 | 411 B |
FilterCmp_NoRangeCheck | 33554455 | 29,952,221.2 ns | 442,176.37 ns | 391,977.84 ns | 0.99 | 0.02 | 397 B |
There is a very slight benefit to the NoRangeCheck, but even when we talk about 32M items, we aren’t talking about a lot of time.
The question what can we do better here?
At some point in any performance optimization sprint, you are going to run into a super annoying problem: The dictionary.
The reasoning is quite simple. One of the most powerful optimization techniques is to use a cache, which is usually implemented as a dictionary. Today’s tale is about a dictionary, but surprisingly enough, not about a cache.
Let’s set up the background, I’m looking at optimizing a big indexing batch deep inside RavenDB, and here is my current focus:
You can see that the RecordTermsForEntries take 4% of the overall indexing time. That is… a lot, as you can imagine.
What is more interesting here is why. The simplified version of the code looks like this:
Basically, we are registering, for each entry, all the terms that belong to it. This is complicated by the fact that we are doing the process in stages:
The part of the code that we are looking at now is the last one, where we already wrote the terms to persistent storage and we need to update the entries. This is needed so when we read them, we’ll be able to find the relevant terms.
At any rate, you can see that this method cost is absolutely dominated by the dictionary call. In fact, we are actually using an optimized method here to avoid doing a TryGetValue() and then Add() in case the value is not already in the dictionary.
If we actually look at the metrics, this is actually kind of awesome. We are calling the dictionary almost 400 million times and it is able to do the work in under 200 nanoseconds per call.
That is pretty awesome, but that still means that we have over 2% of our total indexing time spent doing lookups. Can we do better?
In this case, absolutely. Here is how this works, instead of doing a dictionary lookup, we are going to store a list. And the entry will record the index of the item in the list. Here is what this looks like:
There isn’t much to this process, I admit. I was lucky that in this case, we were able to reorder things in such a way that skipping the dictionary lookup is a viable method.
In other cases, we would need to record the index at the creation of the entry (effectively reserving the position) and then use that later.
And the result is…
That is pretty good, even if I say so myself. The cost went down from 3.6 microseconds per call to 1.3 microseconds. That is almost 3 folds improvement.
Today I ran into this Reddit post, detailing how Moq is now using SponsorLink to encourage users to sponsor the project.
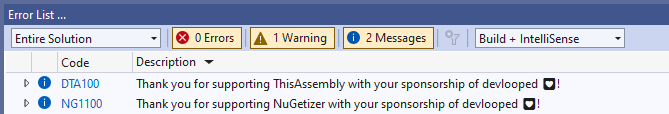
The idea is that if you are using the project, you’ll sponsor it for some amount, which funds the project. You’ll also get something like this:
This has been rolled out for some projects for quite some time, it seems. But Moq is a far more popular project and it got quite a bit of attention.
It is an interesting scenario, and I gave some thought to what this means.
I’m not a user of Moq, just to note.
I absolutely understand the desire to be paid for Open Source work. It takes a lot of time and effort and looking at the amount of usage people get out of your code compared to the compensation is sometimes ridiculous.
For myself, I can tell you that I made 800 USD out of Rhino.Mocks directly when it was one of the most popular mocking frameworks in the .NET world. That isn’t a sale, that is the total amount of compensation that I got for it directly.
I literally cannot total the number of hours that I spent on it. But OpenHub estimates it as 245 man-years. I… disagree with that estimate, but I certainly put a lot of time there.
From a commercial perspective, I think that this direction is a mistake. Primarily because of the economies of software purchases. You can read about the implementation of SponsorLink here. The model basically says that it will check whether the individual user has sponsored the project.
That is… not really how it works. Let’s say that a new developer is starting to work on an existing project. It is using a SponsorLink project. What happens then? That new developer is being asked to sponsor the project?
If this is a commercial project, I certainly support the notion that there should be some payment. But it should not be on the individual developer, it should be on the company that pays for the project.
That leaves aside all the scenarios where this is being used for an open source project, etc. Let’s ignore those for now.
The problem is that this isn’t how you actually get paid for software. If you are targeting commercial usage, you should be targeting companies, not individual users. More to the point, let’s say that a developer wants to pay, and their company will compensate them for that.
The process for actually doing that is atrocious beyond belief. There are tax implications (if they sponsor with 5$ / month and their employer gives them a 5$ raise, that would be taxed, for example), so you need to submit a receipt for expenses, etc.
A far better model would be to have a way to get the company to pay for that, maybe on a per project basis. Then you can detect if the project is sponsored, for example, by looking at the repository URL (and accounting for forks).
Note that at this point, we are talking about the actual process of getting money, nothing else about this issue.
Now, let’s get to the reason that this caused much angst for people. The way SponsorLink works is that it fetches your email from the git configuration file and check wether:
It does both checks using what appears to be: base62(sha256(email));
If you are already a SponsorLink sponsor, you have explicitly agreed to sharing your email, so not a problem there. So the second request is perfectly fine.
The real problem is the first check, when you check if you are a SponsorLink sponsor in the first place. Let’s assume that you aren’t, what happens then.
Well, there is a request made that looks something like this:
HEAD /azure-blob-storage/path/app/3uVutV7zDlwv2rwBwfOmm2RXngIwJLPeTO0qHPZQuxyS
The server will return a 404 if you are not a sponsor at this point.
The email hash above is my own, by the way. As I mentioned, I’m not a sponsor, so I assume this will return 404. The question is what sort of information is being provided to the server in this case?
Well, there is the hashed email, right? Is that a privacy concern?
It is indeed. While reversing SHA256 in general is not possible, for something like emails, that is pretty trivial. It took me a few minutes to find an online tool that does just that.
The cost is around 0.00045 USD / email, just to give some context. So the end result is that using SponsorLink will provide the email of the user (without their express or implied consent) to the server. It takes a little bit of extra work, but it most certainly does.
Note that practically speaking, this looks like it hits Azure Blob Storage, not a dedicated endpoint. That means that you can probably define logging to check for the requests and then gather the information from there. Not sure what you would do with this information, but it certainly looks like this falls under PII definition on the GDPR.
There are a few ways to resolve this problem. The first would be to not use email at all, but instead the project repository URL. That may require a bit more work to resolve forks, but would alleviate most of the concerns regarding privacy. A better option would be to just check for an included file in the repository, to be honest. Something like: .sponsored.projects file.
That would include the ids of the projects that were sponsored by this project, and then you can run a check to see that they are actually sponsored. There is no issue with consent here, since adding that file to the repository will explicitly consent for the process.
Assuming that you want / need to use the emails still, the problem is much more complex. You cannot use the same process as k-Anonymity as you can use for passwords. The problem is that a SHA256 of an email is as good as the email itself.
I think that something like this would work, however. Given the SHA256 of the email, you send to the server the following details:
The prefix is the first 6 letters of the SHA256 hash. The key has cryptography strength of 32 random bytes.
The hash is taking the SHA256 and hashing it again usung HMAC with the provided key.
The idea is that on the server side, you can load all the hashes that you stored that match the provided prefix. Then you compute the keyed HMAC for all of those values and attempt to check if there is a match.
We are trying to protect against a malicious server here, remember. So the idea is that if there is a match, we pinged the server with an email that it knows about. If we ping the server with an email that it does not know about, on the other hand, it cannot tell you anything about the value.
The first 6 characters of the SHA256 will tell you nothing about the value, after all. And the fact that we use a random key to sending the actual hash to the server means that there is no point trying to figure it out. Unlike trying to guess an email, guessing a hash of an email is likely far harder, to the point that it is not feasible.
Note, I’m not a cryptography expert, and I wouldn’t actually implement such a thing without consulting with one. I’m just writing a blog post with my ideas.
That would at least alleviate the privacy concern. But there are other issues.
The SponsorLink is provided as a closed-source obfuscated library. People have taken the time to de-obfuscate it, and so far it appears to be matching the documented behavior. But the mere fact that it is actually obfuscated and closed-source inclusion in an open-source project raises a lot of red flags.
Finally, there is the actual behavior when it detects that you are not sponsoring this project. Here is what the blog post states will happen:
It will delay the build (locally, on your machine, not on CI).
That… is really bad. I assume that this happens on every build (not sure, though). If that is the case, that means that the feedback cycle of "write a test, run it, write code, run a test", is going to hit significant slowdowns.
I would consider this to be a breaking point even excluding everything else.
As I previously stated, I’m all for paying for Open Source software. But this is not the way to do that, there is a whole bunch of friction and not much that can indicate a positive outcome for the project.
Monetization strategies for Open Source projects are complex. Open core, for example, likely would not work for this scenario. Nor would you be likely to get support contracts. The critical aspect is that beyond just the technical details, any such strategy requires a whole bunch of infrastructure around it. Marketing, sales, contract negotiation, etc. There is no easy solution here, I’m afraid.
RavenDB is a .NET application, written in C#. It also has a non trivial amount of unmanaged memory usage. We absolutely need that to get the proper level of performance that we require.
With managing memory manually, there is also the possibility that we’ll mess it up. We run into one such case, when running our full test suite (over 10,000 tests) we would get random crashes due to heap corruption. Those issues are nasty, because there is a big separation between the root cause and the actual problem manifesting.
I recently learned that you can use the gflags tool on .NET executables. We were able to narrow the problem to a single scenario, but we still had no idea where the problem really occurred. So I installed the Debugging Tools for Windows and then executed:
&"C:\Program Files (x86)\Windows Kits\10\Debuggers\x64\gflags.exe" /p /enable C:\Work\ravendb-6.0\test\Tryouts\bin\release\net7.0\Tryouts.exe
What this does is enable a special debug heap at the executable level, which applies to all operations (managed and native memory alike).
With that enabled, I ran the scenario in question:
PS C:\Work\ravendb-6.0\test\Tryouts> C:\Work\ravendb-6.0\test\Tryouts\bin\release\net7.0\Tryouts.exe
42896
Starting to run 0
Max number of concurrent tests is: 16
Ignore request for setting processor affinity. Requested cores: 3. Number of cores on the machine: 32.
To attach debugger to test process (x64), use proc-id: 42896. Url http://127.0.0.1:51595
Ignore request for setting processor affinity. Requested cores: 3. Number of cores on the machine: 32. License limits: A: 3/32. Total utilized cores: 3. Max licensed cores: 1024
http://127.0.0.1:51595/studio/index.html#databases/documents?&database=Should_correctly_reduce_after_updating_all_documents_1&withStop=true&disableAnalytics=true
Fatal error. System.AccessViolationException: Attempted to read or write protected memory. This is often an indication that other memory is corrupt.
at Sparrow.Server.Compression.Encoder3Gram`1[[System.__Canon, System.Private.CoreLib, Version=7.0.0.0, Culture=neutral, PublicKeyToken=7cec85d7bea7798e]].Encode(System.ReadOnlySpan`1<Byte>, System.Span`1<Byte>)
at Sparrow.Server.Compression.HopeEncoder`1[[Sparrow.Server.Compression.Encoder3Gram`1[[System.__Canon, System.Private.CoreLib, Version=7.0.0.0, Culture=neutral, PublicKeyToken=7cec85d7bea7798e]], Sparrow.Server, Version=6.0.0.0, Culture=neutral, PublicKeyToken=37f41c7f99471593]].Encode(System.ReadOnlySpan`1<Byte> ByRef, System.Span`1<Byte> ByRef)
at Voron.Data.CompactTrees.PersistentDictionary.ReplaceIfBetter[[Raven.Server.Documents.Indexes.Persistence.Corax.CoraxDocumentTrainEnumerator, Raven.Server, Version=6.0.0.0, Culture=neutral, PublicKeyToken=37f41c7f99471593],[Raven.Server.Documents.Indexes.Persistence.Corax.CoraxDocumentTrainEnumerator, Raven.Server, Version=6.0.0.0, Culture=neutral, PublicKeyToken=37f41c7f99471593]](Voron.Impl.LowLevelTransaction, Raven.Server.Documents.Indexes.Persistence.Corax.CoraxDocumentTrainEnumerator, Raven.Server.Documents.Indexes.Persistence.Corax.CoraxDocumentTrainEnumerator, Voron.Data.CompactTrees.PersistentDictionary)
at Raven.Server.Documents.Indexes.Persistence.Corax.CoraxIndexPersistence.Initialize(Voron.StorageEnvironment)
That pinpointed things so I was able to know exactly where we are messing up.
I was also able to reproduce the behavior on the debugger:
This saved me hours or days of trying to figure out where the problem actually is.
I’m doing a pretty major refactoring inside of RavenDB right now. I was able to finish a bunch of work and submitted things to the CI server for testing. RavenDB has several layers of tests, which we run depending on context.
During development, we’ll usually run the FastTests. About 2,300 tests are being run to validate various behaviors for RavenDB, and on my machine, they take just over 3 minutes to complete. The next tier is the SlowTests, which run for about 3 hours on the CI server and run about 26,000 tests. Beyond that we actually have a few more layers, like tests that are being run only on the nightly builds and stress tests, which can take several minutes each to complete.
In short, the usual process is that you write the code and write the relevant tests. You also validate that you didn’t break anything by running the FastTests locally. Then we let CI pick up the rest of the work. At the last count, we had about 9 dedicated machines as CI agents and given our workload, an actual full test run of a PR may complete the next day.
I’m mentioning all of that to explain that when I reviewed the build log for my PR, I found that there were a bunch of tests that failed. That was reasonable, given the scope of my changes. I sat down to grind through them, fixing them one at a time. Some of them were quite important things that I didn’t take into account, after all. For example, one of the tests failed because I didn’t account for sorting on a dynamic numeric field. Sorting on a numeric field worked, and a dynamic text field also worked. But dynamic numeric field didn’t. It’s the sort of thing that I would never think of, but we got the tests to cover us.
But when I moved to the next test, it didn’t fail. I ran it again, and it still didn’t fail. I ran it in a loop, and it failed on the 5th iteration. That… sucked. Because it meant that I had a race condition in there somewhere. I ran the loop again, and it failed again on the 5th. In fact, in every iteration I tried, it would only fail on the 5th iteration.
When trying to isolate a test failure like that, I usually run that in a loop, and hope that with enough iterations, I’ll get it to reproduce. Having it happen constantly on the 5th iteration was… really strange. I tried figuring out what was going on, and I realized that the test was generating 1000 documents using a random. The fact that I’m using Random is the reason it is non-deterministic, of course, except that this is the code inside my test base class:
So this is properly initialized with a seed, so it will be consistent.
Read the code again, do you see the problem?
That is a static value. So there are two problems here:
Before fixing this issue so it would run properly, I decided to use an ancient debugging technique. It’s called printf().
In this case, I wrote out all the values that were generated by the test and wrote a new test to replay them. That one failed consistently.
The problem was that it was still too big in scope. I iterated over this approach, trying to end up with a smaller section of the codebase that I could invoke to repeat this issue. That took most of the day. But the end result is a test like this:
As you can see, in terms of the amount of code that it invokes, it is pretty minimal. Which is pretty awesome, since that allowed me to figure out what the problem was:
I’ve been developing software professionally for over two decades at this point. I still get caught up with things like that, sigh.
In this series so far, we reduced the storage cost of key/value lookups by a lot. And in the last post we optimized the process of encoding the keys and values significantly. This is great, but the toughest challenge is ahead of us, because as much as encoding efficiency matters, the absolute cost we have is doing lookups. This is the most basic operation, which we do billions of times a second. Any amount of effort we’ll spend here will be worth it. That said, let’s look at the decoding process we have right now. It was built to be understandable over all else, so it is a good start.
What this code does is to accept a buffer and an offset into the buffer. But the offset isn’t just a number, it is composed of two values. The first 12 bits contain the offset in the page, but since we use 2-byte alignment for the entry position, we can just assume a zero bit at the start. That is why we compute the actual offset in the page by clearing the first four bits and then shifting left by three bits. That extracts the actual offset to the file, (usually a 13 bits value) using just 12 bits. The first four bits in the offset are the indicator for the key and value lengths. There are 15 known values, which we computed based on probabilities and one value reserved to say: Rare key/val length combination, the actual sizes are stored as the first byte in the entry.
Note that in the code, we handle that scenario by reading the key and value lengths (stored as two nibbles in the first byte) and incrementing the offset in the page. That means that we skip past the header byte in those rare situations.
The rest of the code is basically copying the key and value bytes to the relevant variables, taking advantage of partial copy and little-endian encoding.
The code in question takes 512 bytes and has 23 branches. In terms of performance, we can probably do much better, but the code is clear in what it is doing, at least.
The first thing I want to try is to replace the switch statement with a lookup table, just like we did before. Here is what the new version looks like:
The size of the function dropped by almost half and we have only 7 more branches involved. There are also a couple of calls to the memory copy routines that weren’t inlined. In the encoding phase, we reduced branches due to bound checks using raw pointers, and we skipped the memory calls routines by copying a fixed size value at varied offsets to be able to get the data properly aligned. In this case, we can’t really do the same. One thing that we have to be aware of is the following situation:
In other words, we may have an entry that is at the end of the page, if we’ll try to read unconditionally 8 bytes, we may read past the end of the buffer. That is not something that we can do. In the Encode() case, we know that the caller gave us a buffer large enough to accommodate the largest possible size, so that isn’t an issue. That complicates things, sadly, but we can go the other way around.
The Decode() function will always be called on an entry, and that is part of the page. The way we place entries means that we are starting at the top and moving down. The structure of the page means that we can never actually place an entry below the first 8 bytes of the page. That is where the header and the offsets array are going, after all. Given that, we can do an unconditional read backward from the entry. As you can see in the image below, we are reading some data that we don’t care about, but this is fine, we can fix it later, and without any branches.
The end result is that we can have the following changes:
I changed the code to use a raw pointer, avoiding bound checks that we already reasoned about. Most interesting is the ReadBackward function. This is an inner function, and was properly inlined during JIT compilation, it implements the backward reading of the value. Here is what the assembly looks like:
With this in place, we are now at 133 bytes and a single branch operation. That is pretty awesome, but we can do better still. Consider the following code (explanations to follow):
Note that the first element in the table here is different, it is now setting the 4th bit. This is because we are making use of that. The structure of the bytes in the table are two nibbles, but no other value in the table sets the 4th bit. That means that we can operate on that.
Indeed, what we are doing is use the decoder byte to figure out what sort of shift we want. We have the byte from the table and the byte from the buffer. And we use the fact that masking this with 8 gives (just for this value) the value of 8. We can then use that to select the appropriate byte. If we have an offloaded byte, then we’ll shift the value by 8, getting the byte from the buffer. For any other value, we’ll get 0 as the shift index, resulting in us getting the value from the table. That gives us a function with zero branches, and 141 bytes.
I spent a lot of time thinking about this, so now that we have those two approaches, let's benchmark them. The results were surprising:
| Method | Mean | Error | StdDev | |------------------------ |-----------:|---------:|---------:| | DecodeBranchlessShifts | 2,107.1 ns | 20.69 ns | 18.34 ns | | DecodeBranchy | 936.2 ns | 1.89 ns | 1.68 ns |
It turns out that the slightly smaller code with the branches is able to beat up the branchless code. When looking into what they are doing, I think that I can guess why. Branches aren’t a huge problem if they are predictable, and in our case, the whole point of all of this is that the offload process where we need to go to the entry to get the value is meant to be a rare event. In branchless code, on the other hand, you have to do something several times to avoid a branch (like shifting the value from the buffer up and maybe shifting it down, etc).
You can’t really argue with a difference like that. We also tried an AVX version, to see if this would have better performance. It turns out that there is really no way for us to beat the version with the single branch. Everything else was at least twice as slow.
At this point, I believe that we have a winner.
No future posts left, oh my!