Oren Eini

CEO of RavenDB

a NoSQL Open Source Document Database

Get in touch with me:

oren@ravendb.net +972 52-548-6969

Posts: 7,592
|
Comments: 51,223
Privacy Policy · Terms
filter by tags archive
time to read 2 min | 368 words

image

So far we looked into how we can store the nodes and the edges, and we explored some interesting data structures inside Voron. Now, let’s see how we can traverse the graph.

So getting the node is pretty easy, and remember that to access the table by ID gives us an O(1) cost.

Now, what about finding all the edges from a node?

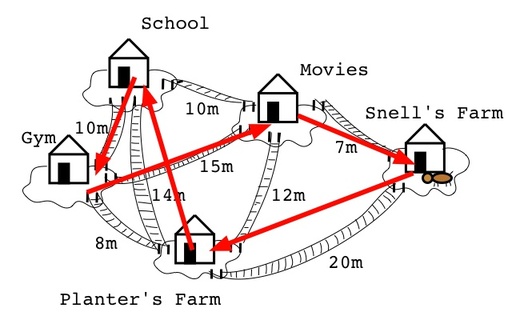
This is a lot heftier, but let’s try to break it into individual pieces. First, we find the tree holding all the edges of that particular type, then we access (by the ID of the source node) the fixed size tree that holds all the connected nodes and the edge data ID.

Finally, we access the edges data (if it exists) to get the data about the edge itself, after which, we return it all to the caller.

Unlike the previous method, here we can’t claim to have O(1) costs. Instead, our costs are composed of:

  1. O(logN) – where N is the number of edges types (typically, very few), to search for the right edges tree.
  2. O(logN) – where N is the number of source nodes (typically, very large, but the fixed size trees are very good at being fast, and they don’t have to do much).
  3. O(N) – where N is the number of connection between the source node and the destination node.

I’m excluding the cost of loading the edge data, since this is an O(1) operation and is directly relevant to the iteration over all nodes connected to the source node.

Ideally, we can find a way to turn the 2nd operation into an O(1) cost, but that should be more than good enough for the moment.

Now, this just gives us traversal of the nodes, but going from here to Breadth First Search / Depth First Search and doing them well is fairly trivial, although there are a few things that we'll need to talk about, but that would serve as a separate post.

time to read 3 min | 559 words

We are going to be using Voron to actually handle the storage of the data. Voron is a low level storage engine, which provide, among other things, fully ACID, MVCC and high performance.

For today, what'll look at are the following operations:

  • Add a node.
  • Add an edge between two nodes.
  • Traverse from a node to all its edges (cheaply)
  • Traverse from an edge to the other node (cheaply).

Here is the interface code that we will need to build:

I tried to make it as simple as it possible could be. I’m using NameValueCollection because it is a trivial property bag to serialize / deserialize without bringing any additional dependencies.

Let us focus on the initialization of this class. We need to create a StorageEnvironment in Voron, and setup some structures.

Voron has several different storage options for data, and in this case, we are using a table. A table (which is very much unlike a RDMBS table) it a way to store records that has some indexes, but in this case, we are doing something strange. We are defining a table that has no indexes (this is so strange that we need to explicitly allow it). This is useful because tables manages indexes for us automatically, but in this case we will use them strictly for storage. We’ll see why in just a bit.


The code here is a bit strange. Tables are actually meant to hold multiple values, and define indexes on this. So using them to store a single value is something that you wouldn’t normally do. Except that the id that we get back from the table has a very interesting property. It has O(1) cost of access. So given a node id, I can access it directly, regardless of how big my database is. That is a property that I want, because effectively random access of nodes is something that happens quite a lot and is highly desirable.

Now, let us see how we can connect two edges, shall we. This code ignores all error handling, missing nodes, etc. It is meant to explain the core stuff, this is a toy database, after all.

Here we continue doing strange stuff. We already know that we use the empty schema table to have an O(1) access to data. And we store the edge’s data there. But then we run into some new stuff. We create a B+Tree called “Edges_”+type, which hold all of the edges of a particular type. But the content of this B+Tree is not simple. Instead, it is using fixed size trees. Those are also B+Trees, but they have well known size both for keys (which must be long) and the value (which must be small < 256 bytes). Because they are very compact, we can pack quite a lot of data into them, and work with them efficiently.

The end result is that we are now storing the node data and access it at O(1) cost. We also store a B+Tree full of fixed size tree (whose name is the source node id) and whose keys are the destination nodes, and the values are the edge data.

Confusing yet? Not much different than Dictionary<SourceNodeId, Dictionary<DestinationNodeId, EdgeDataId>>. That is quite enough for today, tomorrow I’ll show how we can traverse the data, and what kind of costs are associated with it.

time to read 3 min | 487 words

In the Guts n’ Glory of Database Internals posts series (which I’ll probably continue if people suggest new topics), I talked about the very low level things that are involved in actually building a database. From how to ensure consistency to the network protocols. But those are very low level concerns. Important ones, but very low level. In this series, I want to start going up a bit in the stack and actually implement a toy database on top of real production system, to show you what the database engine actually does.

In practice, we divide the layers of a database engine this way:

  1. Low level storage (how we save the bits to disk), journaling, ACID.
  2. High level storage (what kind of storage options do we have, B+Tree, nested trees, etc).
  3. Low level data operations (working on a single item at time).
  4. High level data operations (large scale operations, typically).
  5. Additional features (subscribing to changes, for example).

In order to do something interesting, we are going to be writing a toy graph database. I’m going to focus on levels 3 & 4 here, the kind of data operations that we need to provide the database we want, and we are going to build over pre-existing storage solution that handles 1 & 2.

Selecting the storage engine – sometimes it make sense to go elsewhere for the storage engine. Typical examples includes using LMDB or LevelDB as embedded databases that handles the storage, and you build the data operations on top of that. This works, but it is limiting. You can’t do certain things, and sometimes you really want to. For example, LMDB supports the notion of multiple trees (and even recursive trees), while LevelDB has a flat key space. That has a big impact on how you design and build the database engine.

At any rate, I don’t think it will surprise anyone that I’m using Voron as the storage engine. It was developed to be a very flexible storage engine, and it works very well for the purpose.

We’ll get to the actual code in tomorrow’s post, but let’s lay out what we want to end up with.

  • The ability to store nodes (for simplicity, a node is just an arbitrary property bag).
  • The ability to connect nodes using edges.
    • Edges belong to types, so KNOWS and WORKED_AT are two different connection types.
    • An edge can be bare (no properties) or have data (again, for simplicity, just arbitrary property bag)

The purpose of the toy database we build is to allow the following low level operations:

  • Add a node.
  • Add an edge between two nodes.
  • Traverse from a node to all its edges (cheaply)
  • Traverse from an edge to the other node (cheaply).

That is it, should be simple enough, right?

time to read 3 min | 429 words

Note, this post was written by Federico.

In my last post we talked about the cost of throwing and catching exceptions at the caller site. Some are straightforward and easily seen like the code complexity, but others are a bit deeper, like for instance how the code ends up like that (we will talk about that, but not just yet). Today we will focus on what to do when we control the call-site and are in a performance sensitive hot-spot.

There are 2 important assumptions here:

  • You own the code
  • You are in a hot-spot

If either one of these two is not true, then this is of zero importance or you are screwed. Smile

So let's modify our code a bit (check in yesterday's post if you don’t remember the details). In order to achieve the same result we will resort to a very well-known pattern that I like to call TryXXX. Many instance of such optimizations are visible in the .Net Framework like the famous int.TryParse method. Apparently someone during the course of using v1.0 (or v1.1) of the Framework figured out that the cost of exception handling for certain scenarios was a bit too much. We probably won’t know who was, but we can all be glad they have fixed it; even though we have to live with an exception based implementation (borrowed from Java style?) as obsolete code since then.

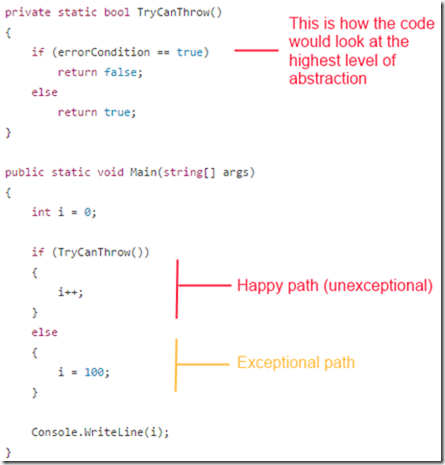
So let's see how the code would look. 

image

Pretty straightforward I might say. Now the interesting thing is what happens at the assembler level:

image

Even under shallow review, we can conclude that this code is definitely faster than the alternative. Now what did we win against the try-catch version? Essentially, we don't have a prolog and an epilog in case of the choosing the exceptional path, that’s faster than having to execute such code. The exception case also does not have to deal with non-local effects caused by unwinding the stack; but we are forced to have a hierarchy of TryXXX methods if that goes deep (the alternative of using exceptions for readability is not great either).

Now in this code we have the first glimpse of evidence of a few JIT design choices (and some current restrictions too) that are important performance wise and we will discuss them in future posts.

time to read 4 min | 624 words

Note, this post was written by Federico.

One guideline which is commonly known is: "Do not use exceptions for flow control." You can read more about it in many places, but this is good compendium of the most common arguments. If you are not acquainted with the reasons, give them a read first; I’ll wait.

Many of the reasons focus on the readability of the code, but remember, my work (usually) revolves around writing pretty disgusting albeit efficient code. So even though I care about readability it is mostly achieved through very lengthy comments on the code on why you shouldn't touch something if you cannot prove something will be faster.

Digression aside the question is still open. What is the impact of using exceptions for control flow (or having to deal with someone else throwing exceptions) in your performance sensitive code? Let's examine that in detail.

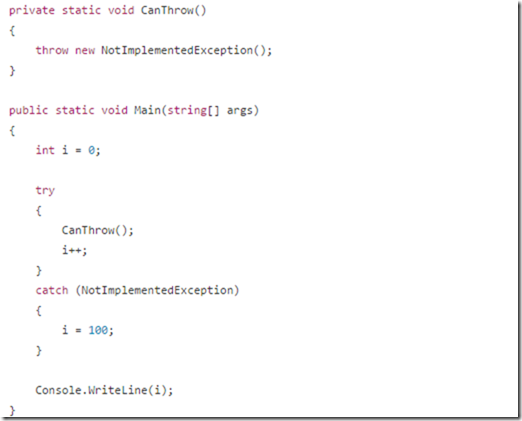
For that we will use a very simple code to understand what can happen. 

image

This is a code that is simple enough so that the assembler won’t get too convoluted, but at the same time sport at least some logic we can use as markers.

Let's first inspect the method CanThrow, in there what we can see is how the throwing of exceptions happen:

image

As you can see there is a lot of things to be done just to throw the exception. There in the last call we will use jump to the proper place in the stack and continue in the catch statement that we hit.

image

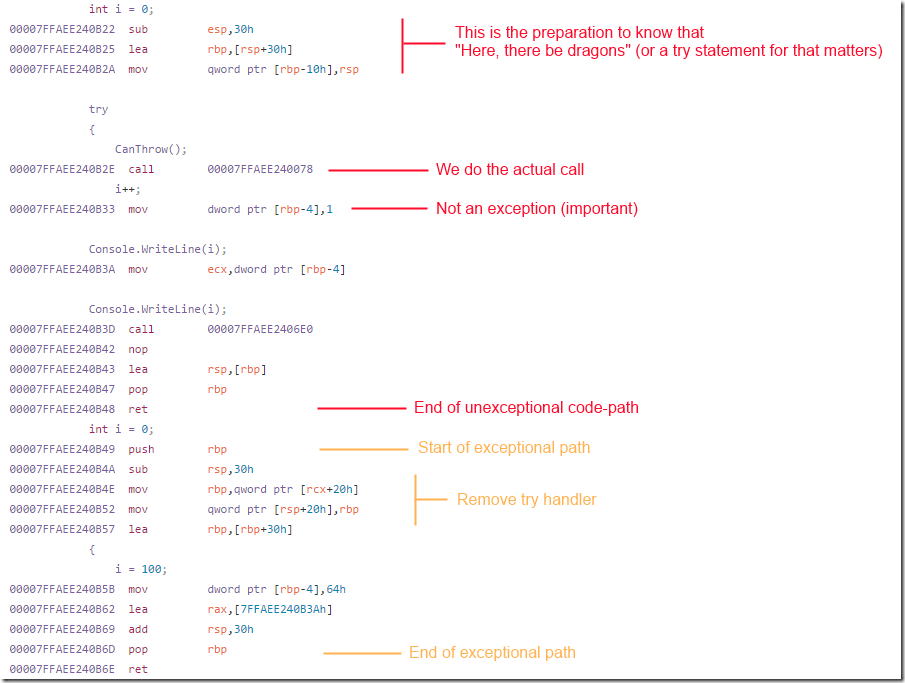
So here is the code of our simple method. At the assembler level, our try statement has a very important implication. Each try-catch forces the method to deal with a few control flow issues. First it has to store the exception handler in case anything inside would throw, then it has to do the actual work. If there is no exception (the happy path) we move forward and end. But what happen if we have an exception? We first need to remove the handler (we don't want to recheck this handler if we end up throwing inside the catch, right?) Then execute the catch and be done.

But now let’s contrast that to the generated code if no try-catch statement happens. The avid reader will realize that the happy path will never be executed because we are throwing, but don’t worry, the code is the same if there is no inlining happening.

image

We will talk about why the code ends up like this in a follow up post, but suffice to say that all this trouble cannot beat a check for a Boolean if you needed to fail (and could do something about it). 

It is also important to remember that this kind of work is only relevant if you are in the hot path. If you are not calling a function at least a few tens of thousands a second, don’t even bother, your performance costs are elsewhere. This is micro optimization land.

time to read 3 min | 401 words

Note, this post was written by Federico.

imageThe .Net Just-In-Time compiler (or JIT for short) is one of those marvels you don't even realize is there, unless you have to smooth talk it to do your bidding. At the Voron level, most routines are so tight that the assembler emitted becomes important. It is not uncommon to have to reason about how the instructions are going to be decoded by the CPU, if the microarchitecture is able to execute two instructions independently or not or we are memory-bound (having too many cache misses).

Those with a C/C++ background know the optimizing compiler is actually quite good at its job; and even so, tricks are required to squeeze the last performance bits. The JIT is no different, with the addition that while the C++ compiler has all the time in the world (sort-of); the restrictions imposed by compiling while your code is executing are far more severe. However, even on a budget, the CoreCLR does a pretty amazing job at optimizing. Until, of course, you expect the performance feats of the offline C++ compiler from it.

So the question you may probably have is: "Why bother? Why don't you just go and write the database in C++?”. I won't go in detail on that, since we covered that already . What I can tell you is, that when you dig into the JIT world, it is pretty easy to achieve performance on par with C++ if the JIT by design doesn't get in your way with unsupported features. Good thing is the CoreCLR team is quite open to tackle those  issues if presented with a detailed analysis on the cost-effectiveness of your optimization.

In this series we will talk about the tricks we had to teach our code to squeeze those last bits of micro-optimizations. From specific optimizations requested to the development team and workarounds until they are available, to tricks we use to ensure the assembler code generated is of the highest quality possible.

One word of caution: The JIT is ever improving so it is important to understand that the optimizations opportunities presented here may not apply tomorrow or just be done automatically in future versions of CoreCLR.

time to read 3 min | 414 words

We run our test suite in a loop to discover any race conditions, timing issues, errors, etc. When doing so, we got a hard crash from the dotnet.exe, and investigating the issue produced a stack trace inside the GC.

So I took a dump of the process memory, and created an issue about that with the CoreCLR repository, while giving it a very high priority internally, and having someone look at that very closely. We are using unsafe code extensively, so it was either a real GC bug or we messed up somewhere are corrupted our own state.

Very quickly Jan Kotas was able to point out that it was a heap corruption issue as well as the likely avenues for investigation.

After looking at this, we found that the problem was in our tests. In particular, in one specific test. In order to test the memory corruption, we changed it to add markers on where it overwrote the buffer, and the test passed.

This caused us additional concern, because the only thing we could think about was that maybe there is some invariant that is being broken. Our suspicion focused on the fixed statement in C# not working properly. Yes, I know, “hoof beats, horses, not zebras”.

So I went to the issue again and reported my finding, and Andy Ayers was kind enough to find the problem, and point it to me.

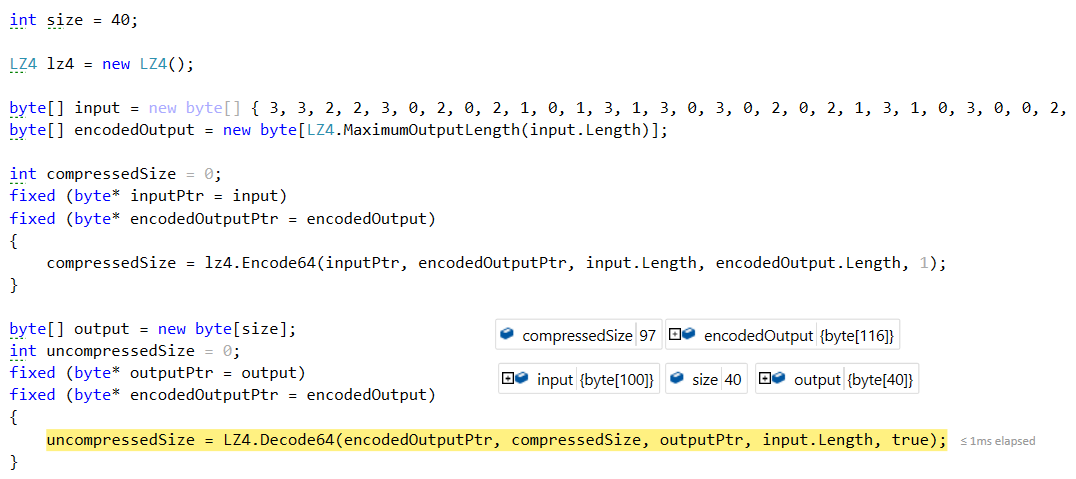
Here is the relevant test code:

image

This is during debugging, so you can see what the problem is. We defined size to be 40, and we defined an input buffer, whose size is 100.

A little bit below, we created an output buffer based on the size variable (40), and then wrote to it with the expected size of input.Length, which is 100. Everything behaved as it should, and we had a buffer overrun in the test, the heap was corrupted, and sometimes the GC died.

Also, I feel very stupid about spouting all sort of nonsense about bugs in the CLR when our code is unable to do simple arithmetic.

The good news, the bug was only in the tests, and the kind of support that you get from Microsoft on the CoreCLR is absolutely phenomenal. Thank you very much guys.

time to read 2 min | 376 words

After talking about transaction merging, there is another kind of database trick that you can use to optimize your performance even further. It is called early lock release. With early lock release, we rely on the fact that the client will only know when the transaction has been committed after we told him. And that we don’t have to tell it right away.

That sounds strange, how can not telling the client that its transaction has been committed improve performance. Well, it improve throughput, but it can also improve the performance. But before we get into the details, let us see the code, and then talk about what it means:

The code is nearly identical to the one in the previous post, but unlike the previous post, here we play a little game. Instead of flushing the journal synchronously, we are going to do this in an async manner. And what is more important, we don’t want for it to complete. Why is that important?

It is important because notifying the caller that the transaction has been complete has now moved into the async callback, and we can start processing additional operations are write them to the journal file at the same time that the I/O for the previous operation completes.

As far as the client is concerned, it doesn’t matter how it works, it just need to get the confirmation that it has been successfully committed. But from the point of view of system resources, it means that we can parallelize a key aspect of the code, and we can proceed with the next set of transactions  before the previous one even hit the disk.

There are some issues to consider. Typically you have only a single pending write operation, because if the previous journal write had an error, you need to abort all future transactions that relied on its in memory state (effectively, rollback that transaction and any speculative transactions we executed assuming we can commit that transaction to disk. Another issue is that error handling is more complex, if a single part of the merge transaction failed, it will fail unrelated operations, so you need to unmerge the transaction, run them individually, and report on each operation individually.

time to read 4 min | 790 words

A repeating choice that we have to make in databases is to trade off performance for scale. In other words, in order to process more requests per time frame, we need to increase the time it takes to process a single request. Let’s see how this works with the case of transaction commits.

In the simplest model, a transaction does its work, prepares itself to be committed, writes itself to the journal, and then notifies the client that it has successfully committed. Note that the most important part of the process is writing to the journal, which is how the transaction maintains durability. It also tends to be, by far, the most expensive part of the operation.

This leads to a lot of attempts to try and change the equation. I talked about one such option when we talked about the details of the transaction journal, having a journal actor responsible for writing the transaction changes as they happen, and amortize the cost of writing them over time and many transactions. This is something that quite a few databases do, but that does have certain assumptions.

To start with, it assumes that transactions are relatively long, and spend a lot of their time waiting for network I/O. In other words, this is a common model in the SQL world, where you have to open a connection, make a query, then make another query based on the results of that, etc. The idea is that you parallelize the cost of writing the changes to the journal along with the time it takes to read/write from the network.

But other databases do not use this model. Most NoSQL databases use the concept of a single command (which may aggregate commands), but they don’t have the notion of a long conversation with the client. So there isn’t that much of a chance to spread the cost of writing to the journal on the network.

Instead, a common trick is transaction merging. Transaction merging relies on the observation that I/O costs are no actually linear to the amount of I/O that you use. Oh, sure, writing 1KB is going to be faster than writing 10 MB. But it isn’t going to be two orders of magnitude faster. In fact, it is actually more efficient to make a single 10MB write than 1024 writes on 1 KB. If this make no sense, consider buying groceries and driving back to your house. The weight of the groceries has an impact on the fuel efficiency of the car, but the length of the drive is of much higher importance in terms of how much fuel is consumed. If you buy 200 KG of groceries (you are probably planning a hell of a party) and drive 10 KB home, you are going to waste a lot less fuel then if you make 4 trips with 50 KG in the trunk.

So what is transaction merging? Put simply, instead of calling the journal directly, we queue the operation we want to make, and let a separate thread run through all the concurrent operations. Here is the code:

The secret here is that if we have a load on the system, by the time we read from the queue, there are going to be more items in there. This means that when we write to the journal file, we’ll write not just a single operation (a trip back & forth to the grocery store), but we’ll be able to pack a lot of those operations immediately (one single trip). The idea is that we buffer all of the operations, up to a limit (in the code above, we use time, but typically you would also consider space), and then flush them to the journal as a single unit.

After doing this, we can notify all of the operations that they have been successfully completed, at which point they can go and notify their callers. We traded off the performance of a single operation (because we now need to be more complex and pay more I/O) in favor of being able to scale to a much higher number of operations. If your platform support async, you can also give up the thread (and let some other request run) while you are waiting for the I/O to complete.

The number of I/O requests you are going to make is lower, and the overall throughput is higher. Just to give you an example, in one of our tests, this single change moved us from doing 200 requests / second (roughly the maximum number of fsync()/ sec that the machine could support) to supporting 4,000 requests per second (x20 performance increase)!

time to read 2 min | 365 words

I’m very happy to announce that the Release Candidate of RavenDB is now available. We have been working hard for the past few months to incorporate feedback that we got from customers who started using the beta, and we are finally ready.

There have been quite a lot of fixes, improvements and enhancements, but in this post I want to focus on the most exciting three.

Waiting for write assurance

Take a look at the following code:

It asks RavenDB to save a new user, and then wait (on the server) for the newly saved changes to be replicated to at least another 2 servers, up to a maximum of 30 seconds.

This give you the option of choosing how safe you want to be on saves. For high value documents (a million dollar order, for example), we will accept the additional delay.

Waiting for indexes

In the same vein, we have this:

This feature is meant specific for PRG (Post, Redirect, Get) scenarios, where you add a new document and immediately query for it. In this case, you can ask the server to wait until the indexes are caught up with this particular write.

You can also set a timeout and whatever to throw or not. But more interestingly, you can specify specific indexes that you want to wait for. If you don’t specify anything, RavenDB will automatically select just the indexes that are impacted by this write.

Dynamic leader selection

In the RavenDB Conference, we showed how you can define a cluster of RavenDB servers and have them vote on a leader dynamically, then route all writes to the leader. In the presence of failure, we will select a new leader and stick to it as long as it is able.

Some of the feedback we got was related to how we select the leader. We now take into account the state of the databases on the server, and will not select a leader whose databases aren’t up to date with regards to replication. We also reduced the cost of replication in general, by significantly reducing the amount of metadata that we need to track.

FUTURE POSTS

  1. Semantic image search in RavenDB - 3 days from now

There are posts all the way to Jul 28, 2025

RECENT SERIES

  1. RavenDB 7.1 (7):
    11 Jul 2025 - The Gen AI release
  2. Production postmorterm (2):
    11 Jun 2025 - The rookie server's untimely promotion
  3. Webinar (7):
    05 Jun 2025 - Think inside the database
  4. Recording (16):
    29 May 2025 - RavenDB's Upcoming Optimizations Deep Dive
  5. RavenDB News (2):
    02 May 2025 - May 2025
View all series

Syndication

Main feed ... ...
Comments feed   ... ...
}