UberProf performance challenges
One of the things that the profiler is supposed to do is to handle large amount of data, so I was pretty bummed to hear that users are running into issues when they try to use the profiler in high load scenarios, such as load tests.
Luckily, one of the things that the profiler can do is output to a file, which let me simulate what is going on on the customer site very easily.
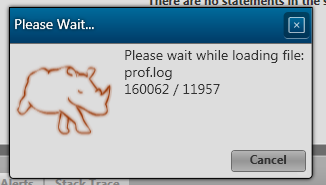
The first performance problem is that the profiler isn’t processing things fast enough:
The second is that there are some things that just totally breaks my expectations
There are solutions for those problems, and I guess that I know what I’ll be doing in the near future :-)


Comments
Is the rhino in the waiting dialog animated?
Yes :-)
So that's 53k queries in one data context? Seems a bit much :D
Yes, that is NOT something that the profiler expects to see, I am afraid to say.
What's with the loading picture, 160.062 out of 11.957? Textbox overflow?
Glenn,
160K loaded, 11K remaining to be processed.
Ah, I guess it's easier to see it when you see the numbers counting.
if you write about features of ÜberProf, do they affect all profilers or do i need an ÜberProf license to get them?
smurf,
When I am talking about UberProf, I am referring to all profilers.
I dont know internals of your loading data... but, maybe, use some of parallelism from .NET 4 would be good. :)
Bah, thats nothing, I've done 1.6 million in a single context before. :p
Why? It was quicker to drag a table into EF than write the sql query manually for a simple nightly processing job. Performance overhead for using an ORM was in "who cares" territory so it worked.
Comment preview