NH Prof new featuresOverall usage and aggregated alerts
Hat tip to Chad Myers for requesting those features.
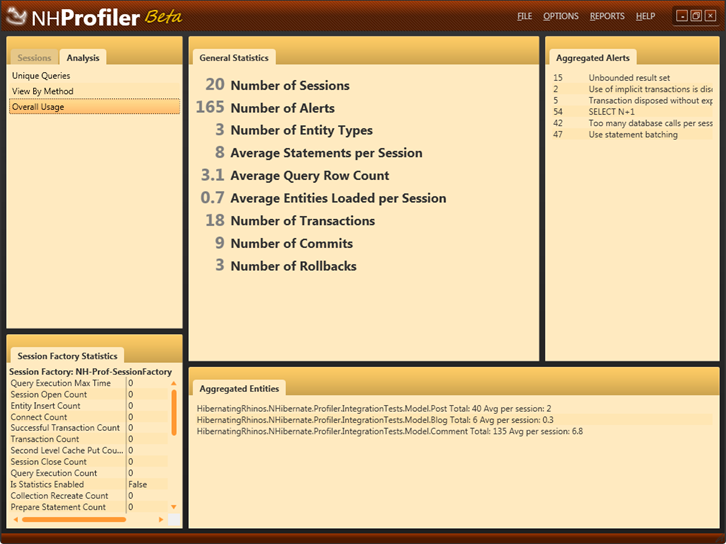
Here is an example of the overall usage report for the entire application.
The aggregated alerts gives you a view about how your application is doing. As you can probably see, this isn't a very healthy application. But since this is actually showing the test suite for the profiler, I am happy with that. On the bottom, you can also see what entities where loaded throughout the entire profiling session, although this is not their final look & feel.
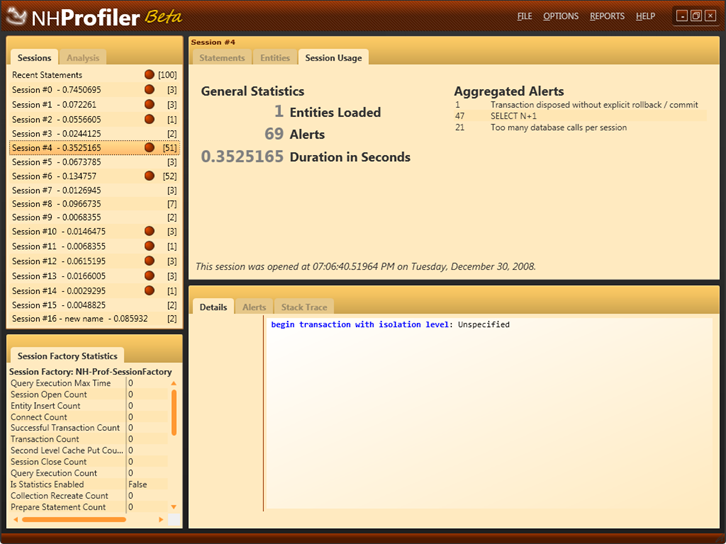
We can also see inspect the details of a particular session.

Again, this is probably not a healthy code base :-) But that is why I created the profiler for.
More posts in "NH Prof new features" series:
- (24 Jan 2009) Disabling & Ignoring Alerts
- (30 Dec 2008) Overall usage and aggregated alerts
- (22 Dec 2008) Analysis


Comments
I don't know if you are ordering alerts somehow, but if you don't, imho it may be a good idea to show the user the importance of each alert (based on your criteria, by showing time taken or whatever) to let them prioritize what must be fixed now, what can wait a bit longer or maybe what's not worth it or even premature optimization (i don't know if it can be the case).
As if I didn't already want to use NH in my applications, this app makes me envy those who are able to. I'll have to start a side project just to use NH and NHProfiler. :)
This is really great, Ayende! I love it. Kudos
Comment preview