Oren Eini

CEO of RavenDB

a NoSQL Open Source Document Database

Get in touch with me:

oren@ravendb.net +972 52-548-6969

Posts: 7,546
|
Comments: 51,161
Privacy Policy · Terms
filter by tags archive
time to read 2 min | 209 words

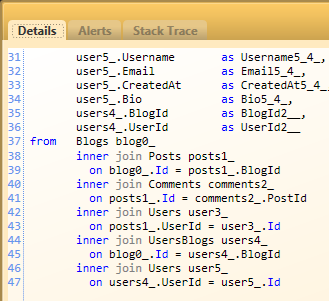
This is Josh’s feature, since we wrote most of the code for it together. Basically, it recognize a very common performance problem, queries that uses too many joins, such as this one:

image

Which would result in the following warning:

image

Queries with too many joins might be a performance problem. Each join requires the database to perform additional work, and the complexity and cost of the query grows rapidly with each additional join. While relational database are optimized for handling joins, it is often more efficient to perform several separate queries instead of a single query with several joins in it.

For OLTP systems, you should consider simplifying your queries or simplifying the data model. While I do not recommend avoiding joins completely, I strong discourage queries with large numbers of joins. Another issue to pay attention to is possible Cartesian products in queries contains joins, it is very easy to create such a thing and not notice it during development.

time to read 2 min | 226 words

One of the things that makes working with the profiler easier is the fact that it gives you not just information, but information in context.

I was working with an app using Rhino Service Bus, and it really bothered me that I couldn’t immediately figure out what was the trigger for a session. When using ASP.Net or WCF, the profiler can show the URL that triggered the request, but when we are not using a url based mechanism, that turns out to be much harder.

So I set out to fix that, you can see the results below:

image

This session was generated by a message batch containing messages for MyBooks, MyQueue, etc.

The integration is composed of two parts, first, from the profiler perspective, you now have the ProfilerIntegration.CurrentSessionContext property, which allows you to customize how the profiler detects the current context.

The second part is the integration from the application framework itself, you can see how I did that for Rhino Service Bus, which will dynamically detect the presence of the profiler and fill the appropriate values. The result makes it a lot easier to track down what is going on.

FUTURE POSTS

  1. Partial writes, IO_Uring and safety - about one day from now
  2. Configuration values & Escape hatches - 4 days from now
  3. What happens when a sparse file allocation fails? - 6 days from now
  4. NTFS has an emergency stash of disk space - 8 days from now
  5. Challenge: Giving file system developer ulcer - 11 days from now

And 4 more posts are pending...

There are posts all the way to Feb 17, 2025

RECENT SERIES

  1. Challenge (77):
    20 Jan 2025 - What does this code do?
  2. Answer (13):
    22 Jan 2025 - What does this code do?
  3. Production post-mortem (2):
    17 Jan 2025 - Inspecting ourselves to death
  4. Performance discovery (2):
    10 Jan 2025 - IOPS vs. IOPS
View all series

Syndication

Main feed Feed Stats
Comments feed   Comments Feed Stats
}