Using dotTrace and dotMemory for production analysis on Linux
Recently JetBrains announce that dotTrace and dotMemory supports profiling applications on Linux. We have been testing these out for production usage, analyzing production scenarios and have been finding (and fixing) issues with about an order of magnitude less work and hassle. I have been a fan of JetBrains for over 15 years and they have been providing excellent software for a long time. So why this post (and no, this isn’t an ad and we are paying for a subscription to JetBrains for all our devs).
I’m super excited about being able to profile on Linux, because this is where most of our customers are now running. Before, we had to use arcane tooling and try to figure things out. With better tools, we are able to pinpoint issues almost immediately.
Here is the result of a single profiling session:

Here, we create a new List and then called ToArray() on it. All we had to do here was just create the array upfront, without going through resize and additional allocations.

Here we had to do a much move involved operation, remembering values across transactions to reduce load. Note how much time we saved!
And of course, just as important:

We tried to optimize an operation. It looks like it didn’t work out exactly as expected, so we need to take additional look at that.
These are about performance, but even more important here is the ability to track memory and its sources. We were able to identify multiple places where we are using too much memory. In some cases, this is about configuration options. In one such case, limiting the amount of memory that we speculatively hold back resulted in a reduction of memory utilization over time from 3.5 GB to 800 MB. And these are much harder to figure out, because it is very hard to see the full picture.
Another factor that became obvious is that RavenDB’s current infrastructure was written in 2015 / 2016. The lowest pieces of the code were written on what was then called DNX. It was written to be high performance and stable. We didn’t have to touch it much ever since. Profiling memory utilization showed us that we hold a large number of values in the large object heap. This is because we need to have a byte[] that we can also send to native code, so we need to pin it. That was because we needed to call some methods, such as Stream.Read(byte[], int,int() and then process it using raw pointers.
When the code was written, that was the only choice. Allocate it on the large object heap ( to reduce fragmentation) and run with it. Now, however, we have Memory<byte> and Span<byte>, which are much easier to work with for this scenario, so we can discard this specific feature and optimize our memory utilization further.
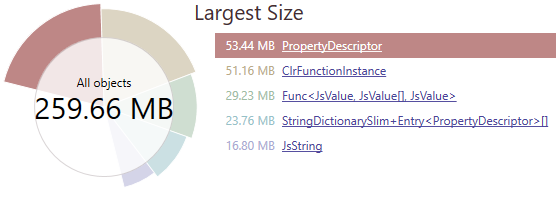
I don’t think we would have gotten to this without the profiler point a big red blinking arrow at the issue. And here is another good example, here is the memory state of RavenDB from dotTrace after running a benchmark consisting of a hundred thousands queries with javascript projections, this one:
And here is the state:
That is… interesting. Why do we have so many? The JavaScript engine is single threaded, but we have concurrent queries, so we use multiple such engines. We cache them, so we have:
And the mechanism there to clean them up will not be triggered normally. So we have this needlessly around. After fixing the cache eviction logic, we get:
Looking at the byte arrays here, we can track this down further, to see that the root cause is the pinning buffer I spoke about earlier. We’re handling that fix in a different branch, so this is pretty good sign that we are done with this kind of benchmark.
The down sides dotTrace and dotMemory, exist. On Linux, dotTrace only supports sampling, not tracing. That sounds like a minor issue, but it means that when I’m running the same benchmark, I’m missing something that I find critical. The number of times a method was run. If a method is taking 50% of the runtime, but it is invoked hundred millions times, I need a very different approach from something that happens three times. The lack on tracing option with number of times the methods were called is a real issue for my usual workflow.
For dotMemory, if you have a highly connected graph (for example, a doubly linked list) and a lot of objects, the amount of resources that it takes to analyze the process is huge. I deployed a cloud machine with 128 GB of RAM and 32 cores to try to analyze an 18 GB process dump. That wasn’t sufficient to give all the details, sadly. It was still able to provide me with enough so I could figure out what the issue was, though.
Another issue is that the visuals are amazing, but when I have a 120 millions links in a node, trying to represent that in the UI is a hopeless cause. I wish that there was a way to dump to text the same information that dotMemory provides. That would allow to analyze ridiculous amount of information in a structured manner.


Comments
Actually starting from 2020.1 version dotTrace supports Tracing profiling mode on Linux and macOS: https://www.jetbrains.com/profiler/whatsnew/
Konstantin ,
I couldn't find any way to activate that.
When trying:
--profiling-type=Tracing- I'm getting an error.Can you point me to the docs discussing how to enable this?--profiling-type=Tracing should work, there are no additional parameters. Are you sure that you are using the 2020.1 version of command-line profiler? What error are you getting?
Comment preview