The process of performance problem fixes with RavenDB
This post isn’t so much about this particular problem, but about the way we solved this.
We have a number of ways to track performance problems, but this is a good example, we can see that for some reason, this test has failed because it took too long to run:
In order to handle that, I don’t want to run the test, I don’t actually care that much about this. So I wanted to be able to run this independently.
To do that, I added:
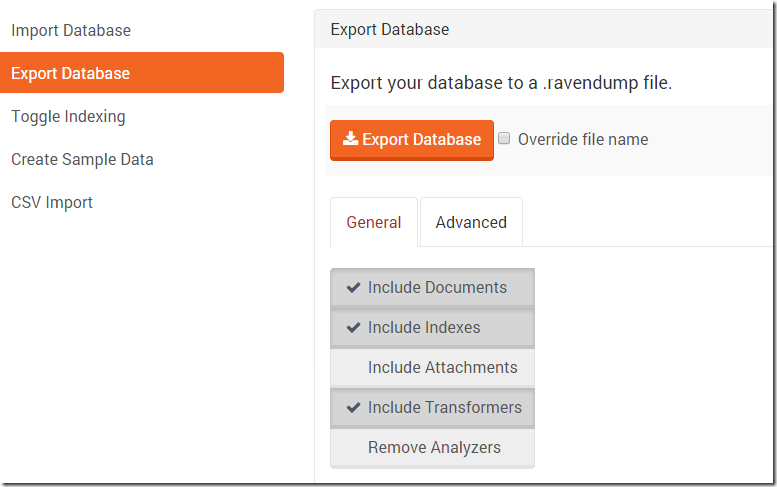
This opens us the studio with all the data that we have for this test. Which is great, since this means that we can export the data.
That done, we can import it to an instance that we control, and start testing the performance. In particular, we can run in under a profiler, to see what it is doing.
The underlying reason ended up being an issue with how we flush things to disk, which was easily fixed once we could narrow it down. The problem was just getting it working in a reproducible manner. This approach, being able to just stop midway through a test and capture the full state of the system is invaluable in troubleshooting what is going on.


Comments
Why not let your perf tests run with ETW Profiling and store that data somewhere? When a perf tests fail you can go back and open the data from the last good and the first bad test run without the need to reproduce anything. You can start analysing the data directly without the need to set up or debug anything. By doing a differential analysis you can find issues quite fast.
Oren,
Is the fix for this in a build yet? I'm occasionally seeing stale indexes for long periods of time (10s or more) in one of my live 3.0 databases.
Alois,
Do you have more information about this? We usually just use a code profiler for such things.
Judah,
Yes, that was resolved.
Are you doing constant writes? Or have very large number of indexes?
WPRUI would produce too many events but you can tune your settings with xperf quite good. You need to enable the CLR JIT Providers to get call stacks for JITed (Win 8 required for x64) and NGenned (works since Win7) code. Since it is a database you should enable sample profiling (1K stack samples/s) and DiscIO, DiscIO_Init and discioinit stackwalking. FileIO would also be good to measure how much data you have shuffled around in your test. With such a hand tuned setup you should be able to record 0-5 minutes without getting a too big ETW file (ca. 1-2GB). ETW is fast you should bareley notice that profiling is enabled at all (ca. 5-20% speed drop). Be sure that you record your perf data to a different drive to prevent any impact while writing the profiling data during the test run.
A good indicator to check if anything has changed is simply by comparing the recorded file size. If something has gone wild you will record much more Events and end up with a much larger file. To check out differences you can use the TraceEvent Library to track the core numbers directly (e.g. Disc IO time / Transaction, #Disc Flushes/Test, ... )
Alois,
This seems to be fairly complex. I can just have standard tests that fail if they take too long, and then run this through a real profiler.
Depends on what you are after. If you want to catch sporadic issues this approach is by far the easiest since you do not need to install two baselines and rexecute tests on a specific machine. This way you can catch virus scanners, Indexing Service, network connectivity and other environmental factors you never have seen before. With "normal" profilers you will not be able to find such issues.
For bigger SW projects where it is not so easy to track what has been changed between two releases it is really helpful to use this approach (currently manually).
Comment preview