Oren Eini

CEO of RavenDB

a NoSQL Open Source Document Database

Get in touch with me:

oren@ravendb.net +972 52-548-6969

Posts: 7,546
|
Comments: 51,161
Privacy Policy · Terms
filter by tags archive
time to read 2 min | 339 words

I really wanted to leave this series of posts alone. Getting 135 times faster should be fast enough for everyone, just like 640KB was.

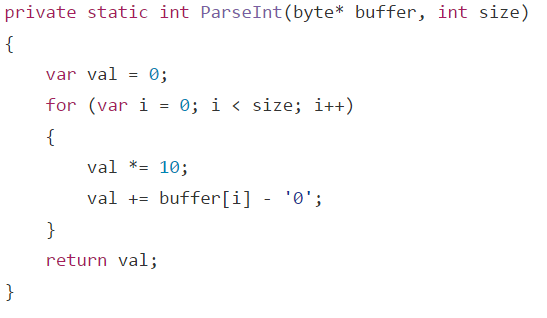
Unfortunately, performance optimization is addictive. Last time, we left it at 283 ms per run. But we still left some performance on the table. I mean, we had inefficient code like this:

image

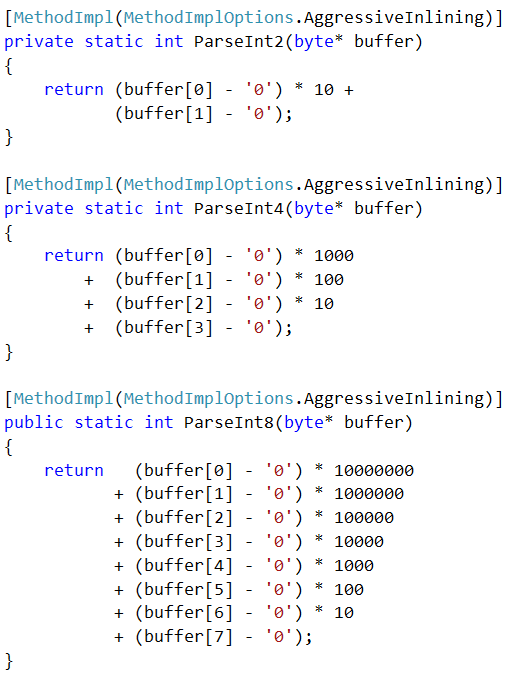
Just look at it. Analysis showed that it is always called with 2, 4 or 8 only. So we naturally simplified things:

image

Forcing the inlining of those methods also helped, and pushed us further toward 240 ms.

Another cost that we had was date diff calculation, we optimized for the case where the day is the same, but in our dataset, we have about 2 million records that cross the day line. So we further optimized for the scenario where the year & month are the same, and just the day is different. That pushed us further toward 220 ms.

At this point the profiler was basically laughing at us, and we had no real avenues to move forward, so I made the code use 4 threads, each processing the file at different locations.

That gave me: 73 ms and allocated 5,640 kb with peak working set of 300,580 kb

  • 527 times faster than the original version.
  • Allocate 1350 times less memory.
  • 1/3 of the working set.
  • Able to process 3.7 GB / sec.

Note that at this point, we are relying on this being in the file system cache, because if I was reading it from disk, I wouldn’t be able to do more than 100 – 200 MB / sec.

Here is the full code, write code like this at your peril.

time to read 3 min | 403 words

Okay, at this point we are really pushing it, but I do wonder if we can get it faster still?

image

So we spend a lot of time in the ParseTime call, parsing two dates and then subtracting them. I wonder if we really need to do that?

I wrote two optimizations, once to compare only the time part if they are the same, and the second to do the date compare in seconds, instead of ticks. Here is what this looks like:

Note that we compare the first 12 bytes using just 2 instructions (by comparing long & int values), since we don’t care what they are, only that they are equal. The result:

283 ms and allocated 1,296 kb with peak working set of 295,200 kb

So we are now 135 times faster than the original version.

Here is the profiler output:

image

And at this point, I think that we are pretty much completely done. We can parse a line in under 75 nanoseconds, and we can process about 1 GB a second on this machine ( my year old plus laptop ).

We can see that the skipping the date compare for time compare if we can pay off in about 65% of the cases, so that is probably a nice boost right there. But I really can’t think of anything else that we can do here that can improve matters in any meaningful way.

For comparison purposes.

Original version:

  • 38,478 ms
  • 7,612,741 kb allocated
  • 874,660 kb peak working set
  • 50 lines of code
  • Extremely readable
  • Easy to change

Final version:

  • 283 ms
  • 1,296 kb allocated
  • 295,200 kb peak working set
  • 180 lines of code
  • Highly specific and require specialize knowledge
  • Hard to change

So yes, that is 135 times faster, but the first version took about 10 minutes to write, then another half an hour to fiddle with it to make it non obviously inefficient. The final version took several days of careful though, analysis of the data and careful optimizations.

time to read 2 min | 343 words

It is a fact of life, if you are looking at a high performance code, a dictionary is probably going to be one of those things that will be painful. Let us see how this look like in our current program:

image

Are you kidding me?! Here I am worrying about every little bit and byte to try to get the most performance out of the system, and Dictionary is eating almost 50% of my performance?

Let us look more deeply into this:

image

So that is about 3 μs, which is pretty fast. But it isn’t fast enough.

Now, know that there are about 200,000 unique values in the dictionary (look at the Insert calls in the profiler output), and we have some knowledge about the problem space.

The id that we use has 8 characters, so at most, we can have a hundred million ids. An array of that size would be roughly 762 MB in size, so that is doable. But we also can be fairly certain that the ids are generated in some sequential manner, so there is a strong likelihood that we don’t need all of this space.

So I wrote the following function:

Changed the stats to start with an array of 256 longs, and run it, the results are nice.

587 ms and allocated 2,576 kb with peak working set of 296,484 kb

And our costs look like:

image

This is single threaded, of course, and it is faster than all the previous multi threaded versions we had before.

time to read 3 min | 456 words

After looking at the profiler results, I realized that we are actually spending a considerable amount of time just writing the output to a file. That didn’t really matter when our code run in 30+ seconds, spending another 100 – 200 ms to write the results was just noise, but when our code is doing that in under a second, that a considerable cost.

I’m running this code on a different machine, so we can’t directly compare. The performance of the initial version is:

38,478 ms and allocated 7,612,741 kb with peak working set of 874,660 kb

And the speed of the latest version is:

842 ms and allocated 208,435 kb with peak working set of 375,452 kb

So we are 45 times faster than the initial version.

The problem is that doing this in parallel takes quite a lot and mask some inefficiencies, so I decided to change it back to using a single threaded approach. Which gives:

1,498 ms and allocated 123,787 kb with peak working set of 319,436 kb

Merely 25 times faster than the original version.

And now let us focus on the output.

This is pretty simple code, but it hides a lot of inefficiencies, in particular, it is doing a lot of allocations as it format the string. We can do much better.

Merely changing the WriteLine to:

output.WriteLine($"{entry.Value.Id} {entry.Value.DurationInTicks}");

Saved us close to 200 ms (!), so there is a lot of space to improve here. Again, this is mostly an issue of creating highly specific code to solve this exact scenario. Here is what I did:

I wrote a simple function to format the number into a buffer, then change the summary line to write a single line into a prepared buffer (and skip all the static stuff), and write the to the file file in one shot.

And the results are:

1,191 ms and allocated 16,942 kb with peak working set of 311,432 kb

You might have noticed that I have two copies of the WriteFormattedInt, this is to skip the implicit cast to long, and yes, it matters, by about 50 ms in my tests. But this version also reduces the number of allocations we have by over 100 MB! So this is great.

And here are the profiler results on analyzing this method:

image

This function is now almost 7 times faster! That is pretty awesome, and even talking about single threaded performance, we are looking at 32 times better than the original version.

Trying the parallel version give me:

731 ms and allocated 101,565 kb with peak working set of 381,224 kb

And a total improvement of 52 times! But we can do even more… I’ll talk about it in the next post.

time to read 2 min | 377 words

After doing all I can without reaching out to the profiler, and managing to get x45 performance gain, let us see what the profiler actually tells us. We’ll use the single threaded version, since that is easier.

Here it is:

image

We can see that dictionary operations take a lot of time, which is to be expected. But what is very surprising is that the date time calls are extremely expensive in this case.

The relevant code for those is here. You can see that it is pretty nice, but there are a bunch of things there that are likely costing us. The exception inside the method prevents in lining, there is error handling here that we don’t need, since we can safely assume in this exercise that the data is valid, etc.

So I changed the ParseTime to do this directly, like so:

And that saved us 11%, just this tiny change.

Here are our current costs:

image

Note that we reduced the cost of parse significantly ( at the cost of error handling, though ), but there are still a lot of work being done here. It turns out that we were actually measuring the time to write to the summary file as well (that is what all those FormatHelpers calls are), so that dirty the results somewhat, but nevermind.

The next place that we need to look at is the Dictionary, it is expensive, even though the usage of FastRecord means that we only need a single call per line, that isn’t so much fun. Note that it is using the GenericEqualityComparer, can we do better?

Trying to create my own equality comparer for longs doesn't really help.

image

So we’ll go back to the parallel version with the ParseTime optimization, and we are now running at 628 ms. And at this rate, I don’t think that there is a lot  more room for improvements, so unless someone suggests something, we are done.

time to read 2 min | 293 words

After introducing the problem and doing some very obvious things, then doing some pretty non obvious things and even writing our own I/O routines we ended up with an implementation that is 17 times faster than the original one.

And yet we can still do better. But at this point, we need to go native and use a bit of unsafe code. We’ll start by implementing a naïve native record parser, like so:

This is pretty much the same as before, but now we are dealing with pointers. How do we use this?

We memory map the file, and then we go over it, doing no allocations at all throughout.

This give us 1 second to process the file, 126 MB allocated (probably in the dictionary) and a peak working set of 320 MB.

We are now 30 times faster than the initial implementation, and I wonder if I can do more… ? We can do that by going parallel, which give us the following code:

This is pretty ugly, but basically we are using 4 threads to run it, and we are giving each one of them a range of the file, as well as their own dedicated records dictionary. After we are done, we need to merge the records to a single dictionary, and that is it.

Using this approach, we can get down to 663 ms run time, 184 MB of allocations and 364 MB peak working set.

So we are now about 45(!) times faster than the original version. We are almost done, but on my next post, I’m going to go ahead and pull the profiler and see if we can squeeze anything else out of it.

time to read 2 min | 308 words

After introducing the problem and doing some very obvious things, and then doing some pretty non obvious things we have managed to get to 1/8 of the initial time of the original implementation.

But we can do better still. So far, we relied heavily on the File.ReadLines method, which handle quite a lot of the parsing complexity for us. However, that would still allocate a string per line, and our parsing relied on us splitting the strings again, meaning more allocations.

We can take advantage of our knowledge of the file to do better. The code size blows up, but it is mostly very simple. We create a dedicated record reader class, which will read each line from the file, with a minimum of allocations.

There is a non trivial amount of stuff going on here. We start by noting that the size in character of the data is fixed, so we can compute the size of a record very easily. Each record is exactly 50 bytes long.

The key parts here is that we are allocating a single buffer variable, which will hold the line characters. Then we just wrote our own date and integer parsing routines that are very trivial, specific to our case and most importantly, don’t require us to allocate additional strings.

Using this code is done with:

So we are back to single threaded mode. Running this code gives us a runtime of 1.7 seconds, 126 MB allocated and a peak working set of 35 MB.

We are now about 2.5 times faster than previous parallel version, and over 17 times faster than the original version.

Making this code parallel is fairly trivial now, divide the file into sections and have a record reader on each section, but is there really much point at this stage?

time to read 2 min | 285 words

After introducing the problem and doing some very obvious things, we have managed to get to 9 seconds instead of 30. That is pretty awesome, but we can do better.

Let us see what would happen if we will write it from scratch, sans Linq.

The code is still pretty small and idiomatic, but not using Linq gave us some interesting numbers. 10.4 seconds to run (so comparable to the parallel Linq), but we also allocated 2.9 GB (down from 3.49 GB) and our peek working set didn’t exceed 30 MB.

Taking the next step and paralleling this approach:

We now have 8 seconds, 3.49 GB of allocations and peak working set of 50 MB. That is good, but we can do better.

Now, instead of using a dictionary of long to long, we’re using a dedicated class, and the key is the string representation of the number. Most of the time, it should save us the need to parse the long. It also means that the number of dictionary operations we need to do is reduced.

This dropped the runtime to 10.2 seconds (compared to 10.4 seconds for the previous single threaded impl). That is good, but this is just the first stage, what I really want to do is save on all those expensive dictionary calls when running in parallel.

Here is the parallel version:

And that one runs at 4.1 seconds, allocates 3 GB and has a peek working set of 48 MB.

We are now close to 8 times faster than the initial version. But we can probably still do better. I’ll go over that in my next post.

time to read 3 min | 427 words

In my previous post, I presented a small code sample and asked how we can improve its performance. Note that this code sample has been quite maliciously designed to be:

  • Very small.
  • Clear in what it is doing.
  • The most obvious way to do it.
  • Highly inefficient.
  • Mislead people into non optimal optimization paths.

In other words, if you don’t get what is going on, you’ll not be able to get the best out of it. And even if you do, it is likely that you’ll try to go in a “minimum change of the code” that isn’t going to be doing as much for performance.

Let us look at the code again:

The most obvious optimization is that we are calling _line.Split() multiple times inside the Record class. Let us fix that:

This trivial change reduce the runtime by about 5 seconds, and saved us 4.2 GB of allocations. The peak working set increased by about 100 MB, which I assume is because the Record class moving from having a single 8 bytes field to having three 8 bytes field.

The next change is also pretty trivial, let us remove the File.ReadAllLines() in favor of calling File.ReadLines(). This, surprisingly enough, has had very little impact on performance.

However, the allocations dropped by 100 MB, and the working set dropped to 280 MB, very much near the size of the file itself.

This is because we no longer have to read the file into an array, and hold on to this array for the duration of the program. Instead, we can collect the garbage from the lines very efficiently.

This conclude the obvious stuff, and we managed to gain a whole 5 seconds of performance improvement here. However, we can do better, and it is sort of obvious, so I’ll put it in this post.

As written this code is single threaded. And while we are reading from a file, we are still pretty much CPU bound, why not use all the cores we have?

As you can see, all we had to do was add AsParallel(), and the TPL will take care of it for us.

This gives us a runtime of 9 seconds, allocations are a bit higher (3.45GB up from 3.3 GB) but the peak working set exceeded 1.1GB. Which makes a lot of sense.

Now, we are now standing at 1/3 of the initial performance, which is excellent, but can we do more? We’ll cover that in the next post.

time to read 3 min | 424 words

Interview questions are always tough to design. On the one hand, you need to create something that will not be trivial to do, and on the other hand, you have a pretty much hard time limit to a reasonable solution. For example, while implementing a linked list is something that I would expect anyone to be able to do in an interview, implementing a binary tree (including the balancing), is probably not going to be feasible.

Interview tasks (that candidate can do at home) are somewhat easier, because you don’t have the same time constraints, but at the same time, if you ask for something that takes a week to write, candidates will skip the question and the position entirely. Another issue here is that if you ask a candidate to send a binary tree as a interview task, they are going to google –> copy & paste –> send, and you learn absolutely nothing*.

* Oh, sometimes you learn quite a lot, if a candidate cannot do that, they are pretty much disqualified themselves, but we could do that more easily with Fizz Buzz, after all.

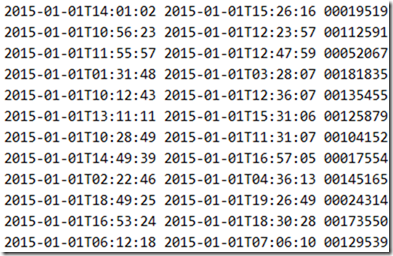
So I came up with the following question, we have the following file (the full data set is 276 MB), that contains the entry / exit log to a parking lot.

image

The first value is the entry time, the second is the exit time and the third is the car id.

Details about this file: This is UTF8 text file with space separated values using Windows line ending.

What we need to do is to find out how much time a car spent in the lot based on this file. I started out by writing the following code:

You can find the full file here. The only additional stuff is that we measure just how much this cost us.

And this code process the 276MB file in 30 seconds, using a peak working set of 850 MB and allocating a total of 7.6 GB of memory.

I’m pretty sure that we can do better. And that is the task we give to candidates.

This has the nice advantage that this is a pretty small and compact problem, but to improve upon it you actually need to understand what is going on under the covers.

I’ll discuss possible optimizations for this next week.

FUTURE POSTS

  1. Partial writes, IO_Uring and safety - about one day from now
  2. Configuration values & Escape hatches - 5 days from now
  3. What happens when a sparse file allocation fails? - 7 days from now
  4. NTFS has an emergency stash of disk space - 9 days from now
  5. Challenge: Giving file system developer ulcer - 12 days from now

And 4 more posts are pending...

There are posts all the way to Feb 17, 2025

RECENT SERIES

  1. Challenge (77):
    20 Jan 2025 - What does this code do?
  2. Answer (13):
    22 Jan 2025 - What does this code do?
  3. Production post-mortem (2):
    17 Jan 2025 - Inspecting ourselves to death
  4. Performance discovery (2):
    10 Jan 2025 - IOPS vs. IOPS
View all series

Syndication

Main feed Feed Stats
Comments feed   Comments Feed Stats
}