Oren Eini

CEO of RavenDB

a NoSQL Open Source Document Database

Get in touch with me:

oren@ravendb.net +972 52-548-6969

Posts: 7,527
|
Comments: 51,164
Privacy Policy · Terms
filter by tags archive
time to read 4 min | 772 words

One of the most important things that you need to do for high performance is to control your allocations. Indeed, the blittable format is almost entirely implemented in unmanaged memory. And we get a great deal of performance from not having the GC poke its annoying little nose into our data structures. That said, it means that we take the onus of managing the memory ourselves.

This post is about a couple of changes that we made to the memory management system in the blittable format, and some future directions we intend to explore.

The first thing that we did was to implement an unmanaged memory pool based on ConcurrentDictionary<int, ConcurrentStack<IntPtr>>. The int is the size (in power of two) of the allocated blocks. And we would allocate from the heap, and then store the buffers internally for reuse. That worked, but profiling showed that we had quite a bit of work in just leasing and returning the buffers to the thread safe pool.

Note that this was when we only tested using a single thread, we expect that the cost of working with it would only increase when using multiple threads.

That sucked.

Luckily, we use the context pattern for pretty much everything in blittable format (and more generally in RavenDB), so we can take advantage of that. We have a three stages process.

First, we allocate the memory when we first request it. Then, when we are done using it, we return it to the context, not the global pool. This allows us to avoid cross thread coordination costs entirely. And it is quite common for threads to need to run the same buffers multiple times, so we save the “check in the buffer” just to “lease me this buffer again, please” style of work.

Here are the costs when using a single shared, thread safe pool:

image

image

As you can see, we spent quite a bit of time just managing the thread safe collections. You don’t see it in this profile, but other profiling sessions show the concurrent dictionary under load as well. And this is in a single threaded, no contention benchmark.

We moved the memory allocations to the context. Because a context is single treaded, we can rely on much simpler (and cheaper) collections, and we can also reuse contexts. A request checks out a context, which has its own cached buffers. It runs through the request, then return the context as a whole to the buffer. Each of those contexts can then manage their own memory and only rarely need to go to the global pool. There is some complexity about making sure that overly fat contexts hang around, but that is basically it.

And when we need to release the data from the context, we can do all of that in a single bulk operation. Here are the profiler results after:

image

image

I admit, it is a bit disappointing to see only a 100% improvement, but I can comfort myself with knowing that the saving in multi threaded scenarios are much higher.

I mentioned that we also have some ideas on improving this furhter. This idea (which we deferred right now because there are other more important things to do) include just allocating a big buffer (128MB in size) per context. We'll not commit all of it, merely reserve the address space, and start allocating from it directly. Basically, each allocation would simply be a pointer increment (with occational calls to commit the rest of the reserved address space).

Now, in order to free the memory, all we need would be to reset the position to zero, and we are set to reuse the context again at effectively zero cost. If this sounds familiar to you, this is because this is primarily how allocations actually work in .NET, except that we explicitly control the size and the lifetime of all the objects in there.

It also has no cost in GC, which is quite nice. As I said, we are thinking about this, but at this point, I think that we are fast enough that we don't need to go there yet. We'll have to see under concurrent usage what this will be.

time to read 6 min | 1066 words

This series of posts is continuting the work I have outlined in this series. While in the previous series, I focused on the overall picture, here I want to talk about the small things we did to speedup pretty much every aspect of the system. In some cases, those are order of magnitude differences.

In this post, I want to talk about the following:

“Oren\r\nEini”

Such a simple thing, if you just look at the surface, and yet if you’ll profile the Json.NET code, you’ll see an interesting issue. I took an existing JSON file (about 67MB in size) and continiously wrote it to /dev/null under a profiler. The results are actually quite surprising.

image

In fact, this is a bit worse.

image

dotTrace has a great feature that allows you to remove “noise” from a trace. Here is what happens if we eliminate this call:

image

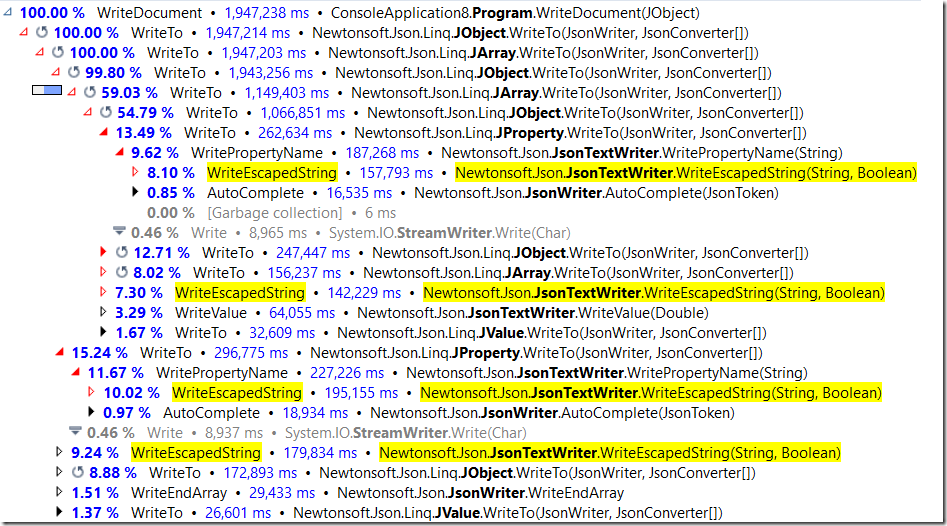
So, pretty obivously, this is an really expensive call. But how expensive is it, really? Note that this profiling run used a Null Stream, so there isn’t any I/O cost to consider. This is the pure computational cost of calling this method.

Let us look at a deeper profiling profiler of this method:

image

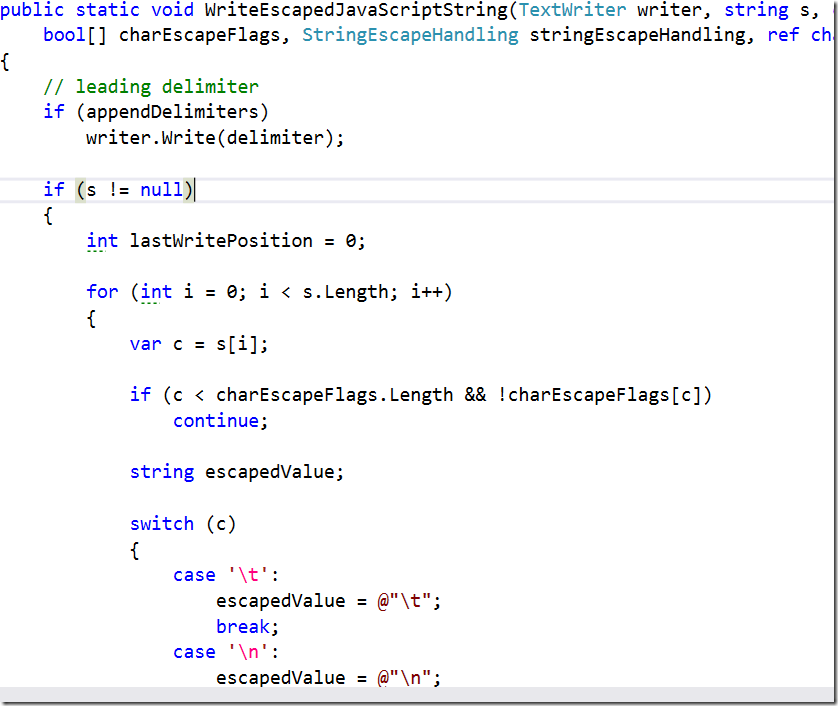
As you can see, WriteEscapedString does about 9% of work, then call WriteEscapedJavaScriptString, which make some calls to the StreamWriter. But about 33% of the time is spend doing its own thing, looking at the code, it is clear what is going on:

image

Basically, before it can write anything, this code needs to go over the string and find out if it has any escape characters. If it does, it needs write the escape sequence, then resume writing the string. This means that this code has to scan the string that it is writing several times, and much worse, it means that you can’t really do justice with those operations. Consider the string above, writing it out is actually several different calls to the writer. In fact, we have:

  • Oren
  • \r
  • \n
  • Eini

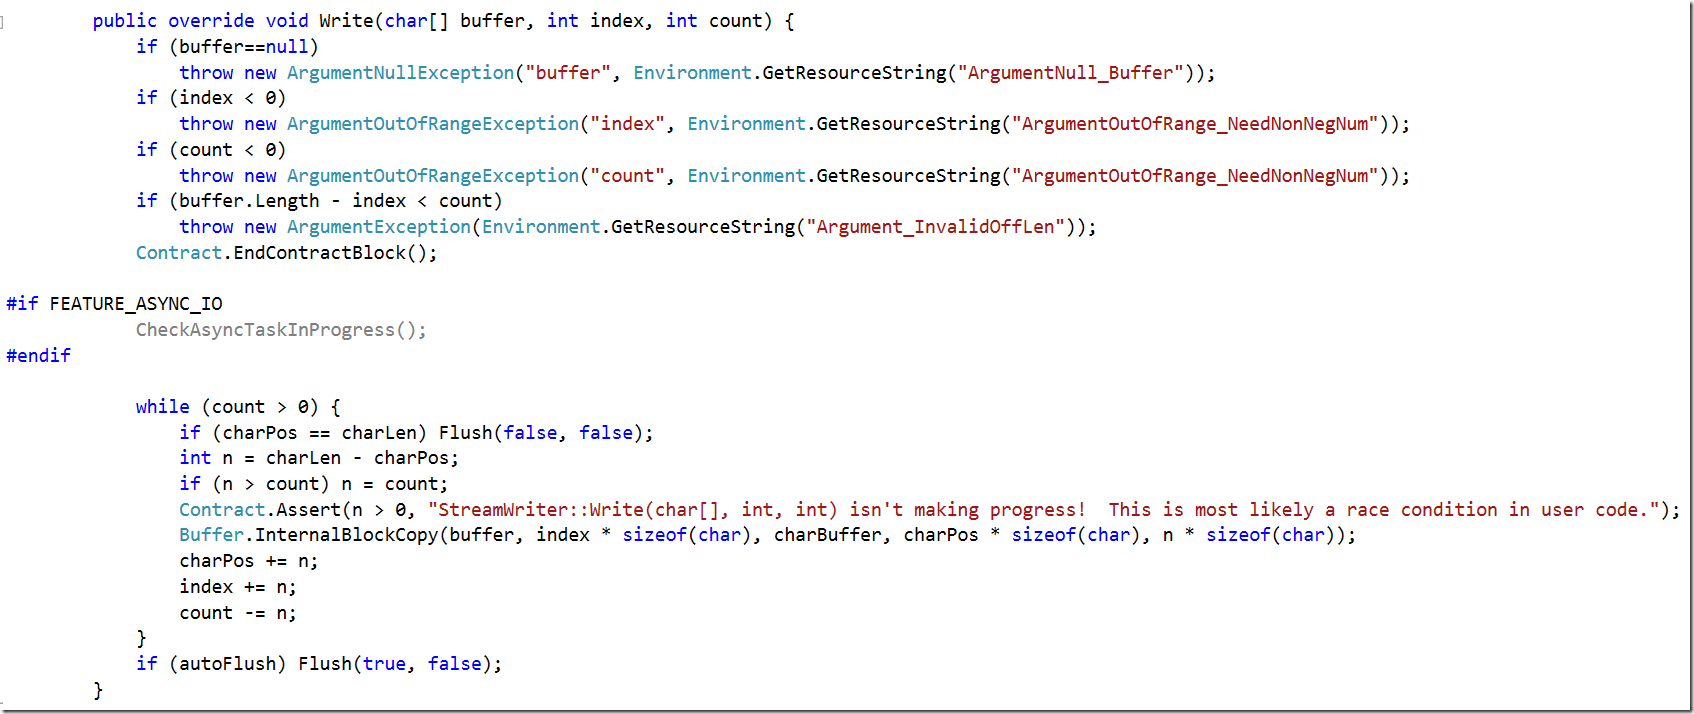
The problem here is that we lose a very powerful feature, the ability to batch multiple operations into a single I/O call. Sure, the TextWriter is going to be doing a bit of buffering for us, but that doesn’t help us really. Let us consider one of the most important calls we have in this code:

image

For the string above, we call this method twice, once for each portion of the string that isn’t escaped. That means that argument validation needs to run each and every time. And we also have to copy the memory in itsy bitsy pieces. Memory copy routines can get far greater speed if they can copy a large bunch of memory all at once, rather than being called on small sections of it.

In short, I hope that this convinced you that escaping strings is expensive. Stupidly so, when you come right down to it.

But what can you do, that is the cost of doing business, right?

Indeed, JSON.Net code is heavily optimized, and there isn’t much you can do about improving things at this point. You are stuck with the JSON format and the implications of it.

This is already a long post, but bear with me while I explain the reasoning.

The blittable format isn’t JSON. We read JSON and output JSON, but we aren’t limited to the same constraints as someone who is just consuming JSON. There are two separate use cases for the document using the blittable format. The first is when we need to work with them on the server side. This include such things as indexing, transformers, patching, etc. For those cases, if there is an escaped value, we need to get the unescaped version. In other words, I need the string with the line break in it, not the \r\n escape sequences. The other common use case, unfortunately, is when we need to write the document to the user, in which case we do need to write it out with all of the escape sequences.

What is left for us, apparently, is to choose our poision. We can optimize for either scenario, but not for both.

Except, that maybe we can. And that is what we actually did.

When we write a string value into the blittable format, we read escape sequences, and translate them into their unescaped values. In other words, we take a “\n” and store just the byte 13. But we also remember its position. The string we keep talking about? It would be stored as:

[10][O][r][e][n][10][13][E][i][n][i][2][4][0]

The first byte (10), is the length of the string. Then we have the actual unescaped version. If the server side code wants to read this string, we can just serve it directly from this memory, without any additional work. But what about when we need to write it down, and maintain the escape sequences? That is where the numbers in the end come into play. We need to skip 10 bytes past the length, where we’ll encounter 3 bytes: 2, 4, 0.

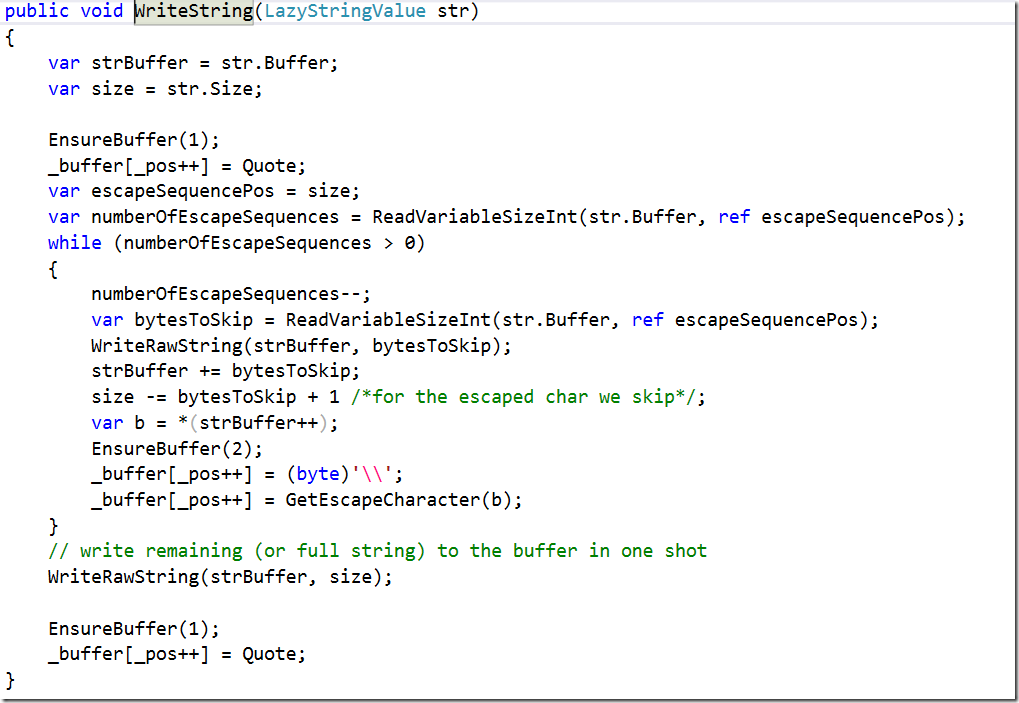
The first byte is the number of escape sequences in the string. The second is the number of bytes that we can copy until we get to the next escape sequence. Which means that our code for writing string has narrowed down to:

image

And that, in turn, means that if you don’t have any escape sequences, we can just call memcpy directly to write to the output buffer. And if you do have escape sequences, we just need to scan the escaped characters, we don’t need to scan the entire string.

There is so much saving in the air, it feels like Black Friday.

FUTURE POSTS

No future posts left, oh my!

RECENT SERIES

  1. RavenDB Cloud (2):
    26 Nov 2024 - Auto scaling
  2. Challenge (75):
    01 Jul 2024 - Efficient snapshotable state
  3. Recording (14):
    19 Jun 2024 - Building a Database Engine in C# & .NET
  4. re (33):
    28 May 2024 - Secure Drop protocol
  5. Meta Blog (2):
    23 Jan 2024 - I'm a JS Developer now
View all series

Syndication

Main feed Feed Stats
Comments feed   Comments Feed Stats
}