Oren Eini

CEO of RavenDB

a NoSQL Open Source Document Database

Get in touch with me:

oren@ravendb.net +972 52-548-6969

Posts: 7,592
|
Comments: 51,223
Privacy Policy · Terms
filter by tags archive
time to read 3 min | 427 words

imageA user reported that when running a set of unit tests against a RavenDB service running on a 1 CPU, 512MB Docker machine instance they were able to reliably reproduce an out of memory exception that would kill the server.

They were able to do that by simply running a long series of pretty simple unit tests. In some cases, this crashed the server.

It took a while to figure out what the root cause was. RavenDB unit tests are run on isolated databases, with each test having their own db. Running a lot of these tests, especially if they were short, will effectively create and delete a lot of databases on the server.

So we were able to reproduce this independently of anything by just running the create/delete database in a loop and the problem became obvious.

Spinning and tearing down a database are pretty big things. Unit tests asides, this is not something that you’ll typically do very often. But with unit tests, you may be creating thousands of them very rapidly. And it looked like that caused a problem, but why?

Well, we had hanging references to this databases. There were two major areas that caused this:

  • Timers of various kinds that might hang around for a while, waiting to actually fire. We had a few cases where we weren’t actually stopping the timer on db teardown, just checking that if the db was disposed when the timer fired.
  • Queues for background operations, which might be delayed because we want to optimize I/O globally. In particular, flushing data to disk is expensive, so we defer it as late as possible. But we didn’t remove the db entry from the flush queue on shutdown, relying on the flusher to check if the db was disposed or not.

None of these are actually really leaks. In both cases, we will clean up everything eventually. But while that happens, this keeps a reference to the database instance, and prevent us from fully releasing all the resources associated with it.

Being more explicitly about freeing all these resource now, rather than waiting a few seconds and have them released automatically made a major difference in this scenario. This was only the case in such small machines because the amount of memory they had was small enough that they run out before they could start clearing the backlog. On machines with a bit more resources, everything will hum along nicely, because we had enough spare capacity.

time to read 1 min | 139 words

image

After close to two months in production incubation, we have finally let RavenDB 4.0 out of the coop.

Major changes since the last RC includes hardening for resource consumption, better performance and insight into exactly what is going on and more robust behavior in the presence of errors.

The major changes from the previous major version includes:

  • 10x better performance
  • Running on Windows, Linux, Mac & Docker
  • Simplified distributed behavior and clustering support

You can get it on the RavenDB site.

This is the culmination of over three years of work and represent an order of magnitude leap in performance, behavior and capabilities.

In addition to all the new features, the 4.0 comes with a free community license that you can use to go for production.

time to read 3 min | 470 words

One of our production server crashed. They do that a lot, because we make them do evil things in harsh environment so they would crash on our end and not when running on your systems. This one is an interesting crash.

We are running the system with auto dump, so a crash will trigger a mini dump that we can run. Here is the root cause of the error, and IOException here:

    SP               IP               Function
    00000024382FF0D0 00007FFD8313108A System_Private_CoreLib!System.IO.FileStream.WriteCore(Byte[], Int32, Int32)+0x3cf7ea
    00000024382FF140 00007FFD82D611A2 System_Private_CoreLib!System.IO.FileStream.FlushWriteBuffer(Boolean)+0x62
    00000024382FF180 00007FFD82D60FA1 System_Private_CoreLib!System.IO.FileStream.Dispose(Boolean)+0x41
    00000024382FF1D0 00007FFD82D60631 System_Private_CoreLib!System.IO.FileStream.Finalize()+0x11

And with this, we are almost done analyzing the problem, right? This is a crash because a finalizer has thrown, so we now know that we are leaking a file stream and that it throws on the finalizer.  We are almost, but not quite, done. We are pretty careful about such things, and most to all of our usages are wrapped in a using statement.

The reason for the error was quite apparent when we checked, we run out of disk space. But that is something that we extensively tested and we are supposed to work fine with that. What is going on?

No disk space is an interesting IO error, because it is:

  • transient, in the sense that the admin can clear some space, and does not expect you to crash.
  • persistent, in the sense that the application can’t really do something to recover from it.

As it turns out, we have been doing everything properly. Here is the sample code that will reproduce this error:

For the moment, ignore things like file metadata, etc. We are writing 12 bytes, and we have only place for 10. Note that calling WriteByte does not go to the disk, extend the file, etc. Instead, it will just write to the buffer and the buffer will be flushed when you call Flush or Dispose.

Pretty simple, right?

Now let us analyze what will happen in this case, shall we?

We call Dispose on the FileStream, and that ends up throwing, as expected. But let us dig a little further, shall we?

Here is the actual Dispose code:

This is in Stream.Dispose. Now, consider the case of a class that:

  • Implements a finalizer, such as FileStream.
  • Had a failure during the Dispose(true); call.
  • Will have the same failure the next time you call Dispose(), even if with Dispose(false);

In this case, the Dispose fails, but the SuppressFinalize is never called, so this will be called from the finalizer, which will also fail, bringing our entire system down.

The issue was reported here and I hope that they will be fixed by the time you read it.

time to read 2 min | 369 words

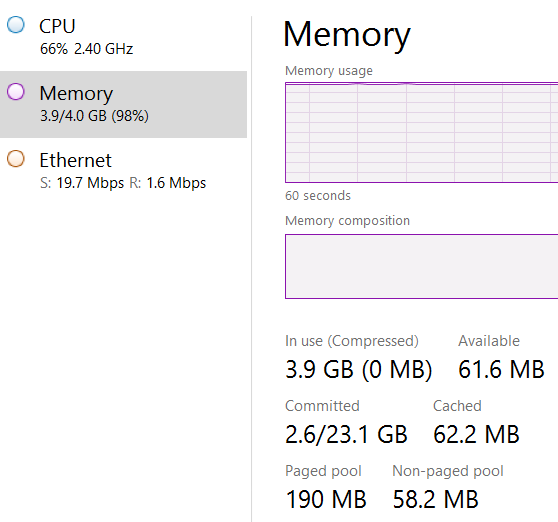
This is a snapshot from our production server right his moment. As you can see, the system is now using every little bit of RAM that it has at its disposal. You can also see that the CPU is kinda busy and the network is quite active.

image

In most cases, an admin seeing this will immediately hit the alarm bell and start figuring out what is causing the system to use all available memory. This looks like a system that is in the precipice of doom, after all.

However, this is a system that is actually:

  • Working as intended
  • Is quite fast
  • Have plenty of extra head room to spare

The problem is that the numbers, as you see them here, are lying to you. The system is using 3.9 GB of memory, but look at the value of the Committed. There are only 2.6GB that are actually committed. Memory internals are complex, but basically, this means that the system need to find place in RAM and on the page file for a 2.6GB. But what about all the other stuff? That is being used, but it isn’t held back from the system if we need it. RavenDB is making active use of all the memory that is available in the system, by way of memory mapped files. Let’s see what the RAMMap tool (which is great is diagnosing such issues) tells us:

image 

So out of a total of 4GB on this machine, about 2.5 GB that are actually in memory are memory mapped files. Out of which we have 1.3 GB in the active set (so they are actively worked on), but we also have 1.1GB here that are in the Standby column.

What this means is that this is memory that is the OS can just repurpose without any extra costs attached. Note that the amount of modified memory (which will require us to write it out to disk) is really small.

This is a good place to be at, even if at first glace it was quite surprising to see.

time to read 3 min | 436 words

imageYou knew that this had to come, after talking about memory and CPU so often, we need to talk about actual I/O.

Did I mention that the cluster was setup by a drunk monkey. That term was raised in the office today, and we had a bunch of people fighting over who was the monkey. So to clarify things, here is the monkey:

image

If you have any issues with this being a drunk monkey, you are likely drunk as well. How about you setup a cluster that we can test things on.

At any rate, after setting things up and push the cluster, we started seeing some odd behaviors. It looked like the cluster was… acting funny.

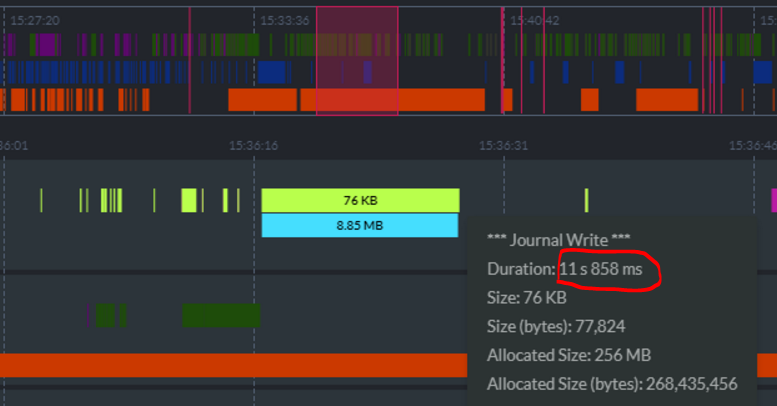
One of the things we build into RavenDB is the ability to inspect its state easily. You can see it in the image on the right. In particular, you can see that we have a journal write taking 12 seconds to run.

It is writing 76Kb to disk, at a rate of about 6KB per second. To compare, a 1984 modem would actually be faster. What is going on? As it turned out, the IOPS on the system was left in their default state, and we had less than 200 IOPS for the disk.

Did I mention that we are throwing production traffic and some of the biggest stuff we have on this thing? As it turns out, if you use all your IOPS burst capacity, you end up having to get your I/O through a straw.

This is excellent, since it exposed a convoy situation in some cases, and also gave us a really valuable lesson about things we should look at when we are investigating issue (the whole point of doing this “setup by a monkey” exercise).

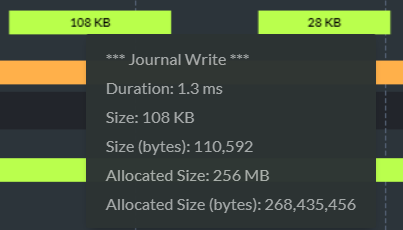
For the record, here is what this looks like when you do things properly:

image

Why does this matter, by the way?

A journal write is how RavenDB writes to the transaction journal. This is absolutely critical to ensuring that the transaction ACID properties are kept.

It also means that when we write, we must wait for the disk to OK the write before we consider it completed. And that means that there were requests somewhere that were sitting there waiting for 12 seconds for a reply because the IOPS run out.

time to read 5 min | 805 words

imageYou might have noticed that we have been testing, quite heavily, what RavenDB can do. Part of that testing focused on running on barely adequate at ridiculous loads.

Because we setup the production cluster like a drunk monkeys, a single high load database was able to affect all other databases.  To be fair, I explicitly gave the booze to the monkeys and then didn’t look when they made a hash of it, because we wanted to see how RavenDB does when setup by someone who has as little interest in how to properly setup things and just want to Get Things Done.

The most interesting part of  this experiment was that we had a wide variety of mixed workload on the system. Some databases are primarily read heavy, some are used infrequently, some databases are write heavy and some are both write heavy and indexing heavy. Oh, and all the nodes in the cluster were setup identically, with each write and index going to all the nodes.

That was really interesting when we started very heavy indexing loads and then pushed a lot of writes. Remember, we intentionally under provisioned, and these machines are 2 cores with 4GB RAM and they were doing heavy indexing, processing a lot of reads and writes, the words.

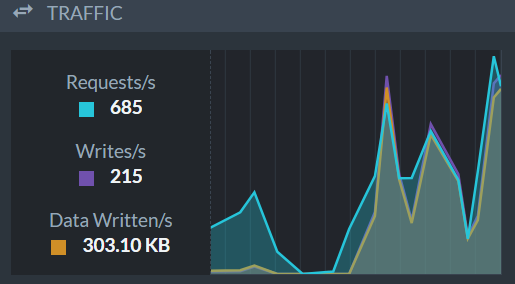
Here is the traffic summary from one of the instances:

image

A very interesting wrinkle that I didn’t mention is that this setup has a really interesting property that we never tested. It has fast I/O, but the number of tasks that are waiting for the two cores is high enough that they don’t get a lot of CPU time on an individual basis. What that means is that it looks like we have I/O that is faster than the CPU.

A core concept of RavenDB performance is that we can send work to the disk to run and in that timeframe we will be able to complete more operations in memory, then send a batch of them to disk. Rinse, repeat, etc.

This wasn’t the case here. By the time we finished a single operation we’ll already have the previous operation completed, and so we’ll proceed with a single operation every time. That killed our performance, and it meant that the transactions merger queue would grow and grow.

We fixed things so we’ll take into account the load on the system when this happens, and we gave a higher priority to the transaction merging thread over normal request processing or indexing. This is because write requests can’t complete before the transaction has been committed, so obviously we don’t want to process further requests at the expense of processing the current requests.

This problem can only occur when we are competing heavily for CPU time, something that we don’t typically see. We are usually constrained a lot more by network or disk. With enough CPU capacity, there is never an issue of the requests and the transaction merger competing for the same core and interrupting each other, so we didn’t consider this scenario.

Another problem we had was the kind of assumptions we made with regards to the processing power. Because we tested on higher end machines, we tested with some ridiculous performance numbers, including hundreds of thousands of writes per second, indexing, mixed read / write load, etc. But we tested that on high end hardware, which means that we got requests that completed fairly quickly. And that led to a particular pattern of resource utilization. Because we reuse buffers between requests, it is typically better to grab a single big buffer and keep using it, rather than having to enlarge it between requests.

If your requests are short, the number of requests you have in flight is small, so you get great locality of reference and don’t have to allocate memory from the OS so often. But if that isn’t the case…

We had a lot of requests in flight. A lot of them because they were waiting for the transaction merger to complete its work, and it was having to fight the incoming requests for some CPU time. So we have a lot of inflight requests, and they intentionally got a bigger buffer than they actually needed (pre-allocating). You can continue down this line of thought, but I’ll give you a hint, it ends with KABOOM.

All in all, I think that it was a very profitable experiment. This is going to be very relevant for users on the low end, especially those running Docker instances, etc. But it should also help if you are running production worthy systems and can benefit from higher utilization of the system resources.

time to read 2 min | 231 words

A common pattern we use is to wrap objects that require disposing of resources with a dispose / finalizer. Here is a simple example:

This is a pretty simple case, and obviously we try to avoid these allocations, so we try to reuse the SecretItem class.

However, when peeking into high memory utilization issue, we run into a really strange situation. We had a lot of buffers in memory, and most of them were held by items that were held in turn by the Finalization Queue.

I started to write up what I figured out about finalizer in .NET, but this post does a great job of explaining everything. The issue here is that we retain a reference to the byte array after the dispose. Because the object is finalizable, the GC isn’t going to be able to remove it on the spot. That means that it is reachable, and anything that it holds is also reachable.

Now, we are trying very hard to be nice to the GC and not allocate too much, which means that the finalizer thread will only wake up occasionally, but that means that the buffer will be held up in memory for a much longer duration.

The fix was the set the Buffer to null during the Dispose call, which means that the GC can pick up that it isn’t actually being used much faster.

FUTURE POSTS

  1. Semantic image search in RavenDB - 2 days from now

There are posts all the way to Jul 28, 2025

RECENT SERIES

  1. RavenDB 7.1 (7):
    11 Jul 2025 - The Gen AI release
  2. Production postmorterm (2):
    11 Jun 2025 - The rookie server's untimely promotion
  3. Webinar (7):
    05 Jun 2025 - Think inside the database
  4. Recording (16):
    29 May 2025 - RavenDB's Upcoming Optimizations Deep Dive
  5. RavenDB News (2):
    02 May 2025 - May 2025
View all series

Syndication

Main feed ... ...
Comments feed   ... ...
}