Understanding memory utilization in RavenDB
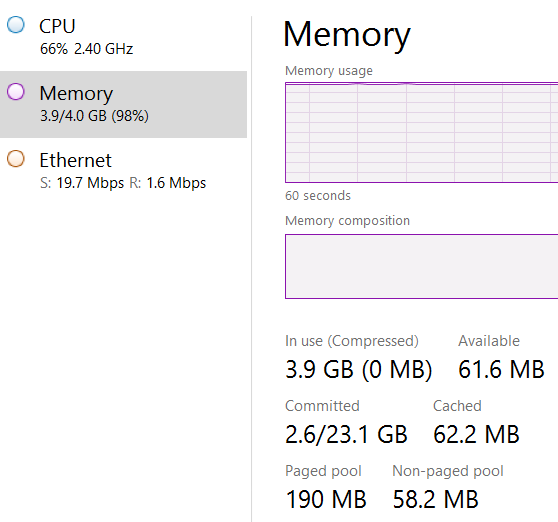
This is a snapshot from our production server right his moment. As you can see, the system is now using every little bit of RAM that it has at its disposal. You can also see that the CPU is kinda busy and the network is quite active.
In most cases, an admin seeing this will immediately hit the alarm bell and start figuring out what is causing the system to use all available memory. This looks like a system that is in the precipice of doom, after all.
However, this is a system that is actually:
- Working as intended
- Is quite fast
- Have plenty of extra head room to spare
The problem is that the numbers, as you see them here, are lying to you. The system is using 3.9 GB of memory, but look at the value of the Committed. There are only 2.6GB that are actually committed. Memory internals are complex, but basically, this means that the system need to find place in RAM and on the page file for a 2.6GB. But what about all the other stuff? That is being used, but it isn’t held back from the system if we need it. RavenDB is making active use of all the memory that is available in the system, by way of memory mapped files. Let’s see what the RAMMap tool (which is great is diagnosing such issues) tells us:
So out of a total of 4GB on this machine, about 2.5 GB that are actually in memory are memory mapped files. Out of which we have 1.3 GB in the active set (so they are actively worked on), but we also have 1.1GB here that are in the Standby column.
What this means is that this is memory that is the OS can just repurpose without any extra costs attached. Note that the amount of modified memory (which will require us to write it out to disk) is really small.
This is a good place to be at, even if at first glace it was quite surprising to see.


Comments
How does such a system actually perform when the memory pressure happens? Say we have another unrelated server process on the same machine that suddenly experiences a spike in requests, which triggers a higher-than-normal usage of both memory and CPU. Does everything just smooth out at some equilibrium or can bad things (tm) happen?
Aleksander,
That is the beauty. The memory management is at the hands of the OS, and it is capable of making such determination much better than a single app can, because it has a global view.
The same things that allow the OS to evict memory easily when ravendb needs it also means it can do this for other processes, making ravendb a good neighbor to have.
Comment preview