Performance optimizationsRinse, Repeat, Repeat, Repeat
Originally posted at 1/18/2011
We got some reports that there was an O(N) issue with loading large number of documents from Raven.
I wrote the following test code:
var db = new DocumentDatabase(new RavenConfiguration
{
    DataDirectory = "Data"
});
Console.WriteLine("Ready");
Console.ReadLine();
while (true)
{
    var sp = Stopwatch.StartNew();

    db.Query("Raven/DocumentsByEntityName", new IndexQuery
    {
        Query = "Tag:Item",
        PageSize = 1024
    });

    Console.WriteLine(sp.ElapsedMilliseconds);
}
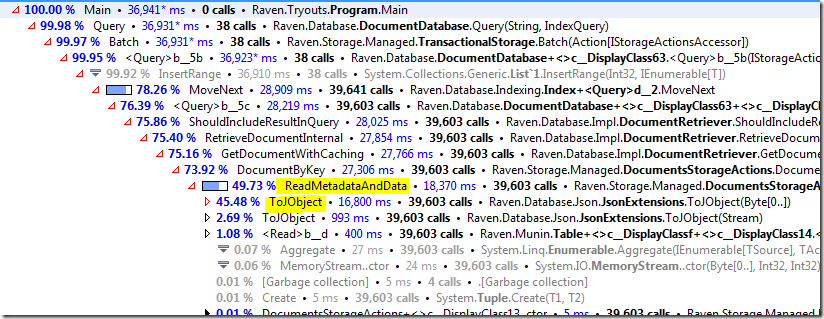
With 1,024 documents in the database, I could clearly see that most requests took in the order of 300 ms. Not content with that speed, I decided to dig deeper, and pulled out my trusty profiler (dotTrace, and no, I am not getting paid for this) and got this:
As should be clear, it seems like de-serializing the data from byte[] to a JObject instance is taking a lot of time (relatively speaking).
To be more precise, it takes 0.4 ms, to do two deserialization operations (for the following document):
{
    "cartId": 666,
    "otherStuff": "moohahaha",
    "itemList": [{
        "productId": 42,
        "name": "brimstone",
        "price": 6.66,
        "quantity": 2000
    },
    {
        "productId": 42,
        "name": "brimstone",
        "price": 6.66,
        "quantity": 2000
    },
    {
        "productId": 42,
        "name": "brimstone",
        "price": 6.66,
        "quantity": 2000
    },
    {
        "productId": 42,
        "name": "brimstone",
        "price": 6.66,
        "quantity": 2000
    },
    {
        "productId": 42,
        "name": "brimstone",
        "price": 6.66,
        "quantity": 2000
    },
    {
        "productId": 42,
        "name": "brimstone",
        "price": 6.66,
        "quantity": 2000
    },
    {
        "productId": 42,
        "name": "brimstone",
        "price": 6.66,
        "quantity": 2000
    },
    {
        "productId": 42,
        "name": "brimstone",
        "price": 6.66,
        "quantity": 2000
    }]
}
I found it quite surprising, to tell you the truth. I wrote the following test case to prove this:
static void Main()
{

    var st =
        "IQAAAAJSYXZlbi1FbnRpdHktTmFtZQAFAAAASXRlbQAAvgIAABJjYXJ0SWQAmgIAAAAAAAACb3RoZXJTdHVm"+
        "ZgAKAAAAbW9vaGFoYWhhAARpdGVtTGlzdACFAgAAAzAATQAAABJwcm9kdWN0SWQAKgAAAAAAAAACbmFtZQAKA"+
        "AAAYnJpbXN0b25lAAFwcmljZQCkcD0K16MaQBJxdWFudGl0eQDQBwAAAAAAAAADMQBNAAAAEnByb2R1Y3RJZAA"+
        "qAAAAAAAAAAJuYW1lAAoAAABicmltc3RvbmUAAXByaWNlAKRwPQrXoxpAEnF1YW50aXR5ANAHAAAAAAAAAAMy"+
        "AE0AAAAScHJvZHVjdElkACoAAAAAAAAAAm5hbWUACgAAAGJyaW1zdG9uZQABcHJpY2UApHA9CtejGkAScXVhbn"+
        "RpdHkA0AcAAAAAAAAAAzMATQAAABJwcm9kdWN0SWQAKgAAAAAAAAACbmFtZQAKAAAAYnJpbXN0b25lAAFwcmljZ"+
        "QCkcD0K16MaQBJxdWFudGl0eQDQBwAAAAAAAAADNABNAAAAEnByb2R1Y3RJZAAqAAAAAAAAAAJuYW1lAAoAAABi"+
        "cmltc3RvbmUAAXByaWNlAKRwPQrXoxpAEnF1YW50aXR5ANAHAAAAAAAAAAM1AE0AAAAScHJvZHVjdElkACoAAAAAA"+
        "AAAAm5hbWUACgAAAGJyaW1zdG9uZQABcHJpY2UApHA9CtejGkAScXVhbnRpdHkA0AcAAAAAAAAAAzYATQAAABJwcm9"+
        "kdWN0SWQAKgAAAAAAAAACbmFtZQAKAAAAYnJpbXN0b25lAAFwcmljZQCkcD0K16MaQBJxdWFudGl0eQDQBwAAAAAAAA"+
        "ADNwBNAAAAEnByb2R1Y3RJZAAqAAAAAAAAAAJuYW1lAAoAAABicmltc3RvbmUAAXByaWNlAKRwPQrXoxpAEnF1YW50a"+
        "XR5ANAHAAAAAAAAAAAA";
    var buffer = Convert.FromBase64String(st);

    while (true)
    {
        var sp = Stopwatch.StartNew();
        for (int i = 0; i < 1024; i++)
        {
            DoWork(buffer);
        }
        Console.WriteLine(sp.ElapsedMilliseconds);
    }
}

private static void DoWork(byte[] buffer)
{
    var ms = new MemoryStream(buffer);
    JObject.Load(new BsonReader(ms));
    JObject.Load(new BsonReader(ms));
}
On my machine, this run at around 70ms for each 1,204 run. In other words, it takes significantly less I would have thought. Roughly 0.06 ms.
Note: The first number (0.4 ms) is under the profiler while the second number (0.06ms) is outside the profiler. You can routinely see order of magnitude differences between running inside and outside the profiler!
So far, so good, but we can literally see that this is adding almost a 100 ms to the request processing. That is good, because it is fairly simple to fix.
What I did was introduce a cache inside the serialization pipeline that made the entire cost go away. Indeed, running the same code above showed much better performance, an average of 200 ms.
The next step is to figure out where is the next cost factor… For that, we use the profiler.
And… we can see the the cost of de-serializing went drastically down. Now the actual cost is just doing a search for the document by the key.
You might have noticed that those results are for Munin. I have run the same test results with Esent, with remarkable similarity in the overall performance.
More posts in "Performance optimizations" series:
- (11 Apr 2017) One step forward, ten steps back
- (23 Jan 2011) Rinse, Repeat, Repeat, Repeat


Comments
Hi Oren,
Thanks for sharing another interesting story from the trenches. Always warms one's heart to see someone applying actual software craftsmanship instead of slapping together a piece of quick & dirty cruft.
I'm afraid the number of developpers who have the motivation and/or skills and/or time allocated to do that kind of deep analysis without a terrible performance showstopper forcing them to do so (like 45 secondes instead of your 400ms) is depressingly low. Some of that is probably due to most projects not allocating enough resources to that kind of endeavours though.
Anyway, always nice to see how you do it, and hope you can inspire a few more to do it as well.
Comment preview