Profiling with dotTrace
I have a tiny feature and a bug fix that I want to implement before I am going to focus solely improving SvnBridge performance. This is a really quick analysis of a single scenario.
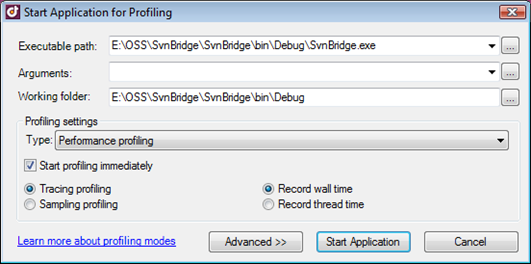
Start dotTrace and set the application to profile then start it. There are a lot of options, but the default was always good for me.
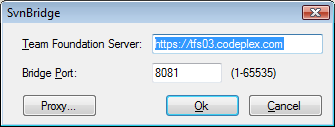
In the application, prepare it for the scenario that you are going to perform. (In SvnBridge's case, this means just setting up the server to talk to):
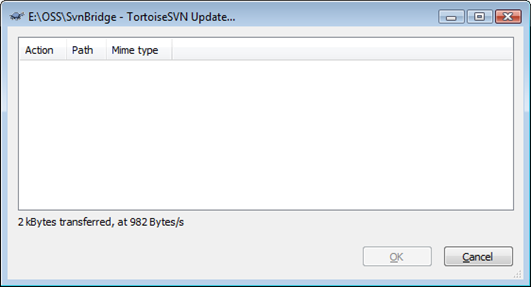
Perform some actions against the application:
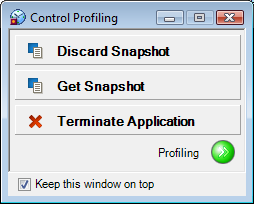
When you are done, hit Get Snapshot:
Now, I tend to go to the hotspots and check what is costing me.
The first line, WaitMessage call is fine, this is the WinForms client that is not doing much at the moment.
The second I can't really figure out, it is starting a thread, but that doesn't take so long. I am pretty sure that this is a case of mis-measuring, or just me not understanding this, but never mind that.
The rest of the calls, which takes huge amount of time, are... remote calls. I guess I should stop talking to TFS :-)


Comments
"The second I can't really figure out, it is starting a thread, but that doesn't take so long. I am pretty sure that this is a case of mis-measuring,"
Switching to thread time instead of wall time might make those timings more clear, as wall time counts time sleeping.
Oh the chattiness of TFS...one place I worked at could only branch on weekends as it would take down the entire server for the other several hundred developers connecting to it. Lots of fun getting calls from Malaysia and Europe screaming "I can't access source control!!!"
u should really give aqtime a run. much better than dotrace.
@asher: [citation needed]
I'm sure you already recognize this; but one thing I noticed while using dotTrace and lots of remote calls, is that while your code is slowed down by the profiler, service and db calls aren't. So it's hard to directly compare how much time a remote call takes compared to an internal one, since the internal one is being exaggerated. So your remote calls are probably taking even longer percentage wise than they would appear to be in the profiler.
Does dottrace already support .net 3.5 ? The vs.net profiler in 2008 is starting to get on my nerves with its requirement of working with unsigned code...
Comment preview