RavenDB CloudMetrics & Disk I/O enhancements
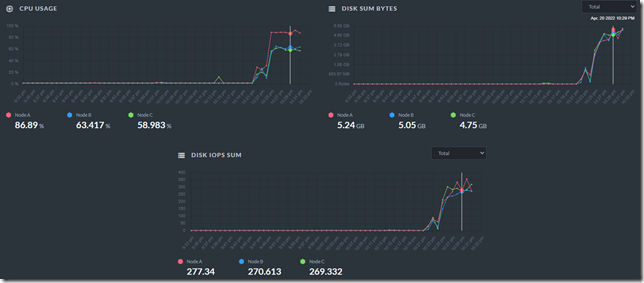
Our cloud team just finished pushing a big set of features to production. Some of them are user facing and add some nice features that I wanted to talk about. The most important feature we have in this cycle is directly exposing your instances metrics to you.
Here is what this looks like:
This is a significant quality of life improvement for both our users and the cloud support team, since that makes it much easier to understand what is going on from an operational perspective.
From experience, one of the most common issues that users are running into is hitting the limits of their I/O. Disk I/O in the cloud is a… complicated beast. As a database, RavenDB is sensitive to the I/O platform that it is running on. We have now made it clear what exactly you are getting from the underlying system. This is what this looks like:
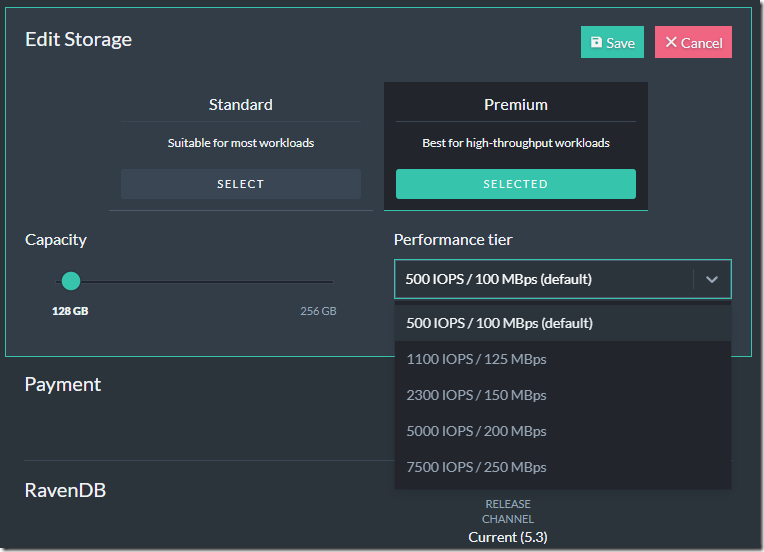
You can also raise those values, of course. In fact, you can now selectively raise your disk performance selectively on Azure (you could always do that on AWS). This is what this looks like:
As you can see, you can change both the size of the disk (which is permanent) and the performance tier. On Azure, you may change the performance tier for the disk every 12 hours (6 hours on AWS), so that isn’t something that you enable instantly. It is a very useful feature if you are expected a high load (such as big import, deployment of new indexes on large databases, initial replication, etc). Once the load is complete, you can reduce the performance tier and use a cheaper disk for your needs.
The metrics & the ability to change the disk performance tier means that you don’t need to contact support to either figure out what is wrong or what to do about it.
More posts in "RavenDB Cloud" series:
- (26 Nov 2024) Auto scaling
- (21 Apr 2022) Metrics & Disk I/O enhancements


Comments
Love the added information, if you are taking suggestions :D a price difference would be nice to see but that might be a bit more complicated? currently I go to the pricing calculator to try and reproduce my current setup and make a guess.
For the IOPS for example, how can we best interpret the data? for aggregation average I'm seeing numbers 40-80, for max I'm seeing 1500-2000 while I have 1100 iops.
Steve,
What we are showing on the Product Details view is the baseline IOPS and baseline throughput number. Those disks are burstable to some extent, but since that burst ability goes out after a short while (half an hour or so) we decided to show the baseline value instead.
Great feature, how do we get to it in the studio app?
Bob,
That isn't on the RavenDB Studio - this is on the cloud.ravendb.net website.
Currently available for Azure only
Comment preview