Benchmarking RavenDB bulk insert on commodity hardware
We got a few requests for some guidance on how to optimize RavenDB insert rate. Our current benchmark is standing at 135,000 inserts/sec on a sustained basis, on a machine that cost less than a 1,000$. However, some users tried to write their own benchmarks and got far less (about 50,000 writes / sec). Therefor, this post, in which I’m going to do a bunch of things and see if I can make RavenDB write really fast.
I’m sorry, this is likely to be a long post. I’m going to be writing this as I’m building the benchmark and testing things out. So you’ll get a stream of consciousness. Hopefully it will make sense.
Because of the size of this post, I decided to move most of the code snippets out. I created a repository just for this post, and I’m showing my steps as I go along.
Rules for this post:
- I’m going to use the last stable version of RavenDB (4.2, at the time of writing)
- Commodity hardware is hard to quantify, I’m going to use AWS machines because they are fairly standard metric and likely where you’re going to run it.
- Note that this does mean that we’ll probably have less performance than if we were running on dedicated hardware.
- Another thing to note (and we’ll see later) is that I/O rate on the cloud is… interesting topic.
- No special system setup
- Kernel config
- Reformatting of hard disk
- Changing RavenDB config parameters
The first thing to do is to figure out what we are going to write.
The test machine is: t3a.xlarge with 4 cores, 16 GB RAM. This seemed like a fairly reasonable machine to test with. I’m using Ubuntu 18.04 LTS as the operating system.
The machine has an 8GB drive that I’m using to host RavenDB and a separate volume for the data itself. I create a 512GB gp2 volume (with 1536 IOPS) to start with. Here what this looked like from inside the machine:
I’m including the setup script here for completeness, as you can see, there isn’t really anything here that matters.
Do note that I’m going the quick & dirty mode here without security, this is mostly so I can see what the impact of TLS on the benchmark is at a later point.
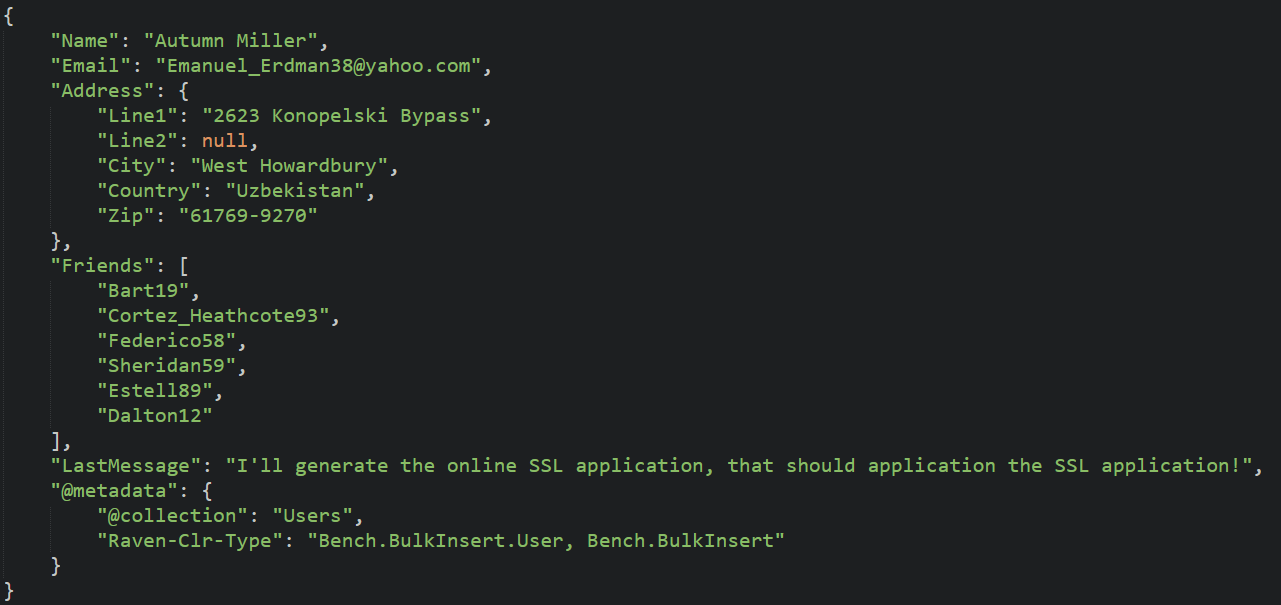
We are now pretty much ready, I think. So let’s take a look at the first version I tried. Writing 100,000 random user documents like the following:
As you can see, that isn’t too big and shouldn’t really be too hard on RavenDB. Unfortunately, I discovered a problem, the write speed was horrible.
Oh wait, the problem exists between keyboard and chair, I was running that from my laptop, so we actually had to go about 10,000 KM from client to server. That… is not a good thing.
Writing the data took almost 12 minutes. But at least this is easy to fix. I setup a couple of client machines on the same AZ and tried again. I’m using spot instances, so I got a t3.large instance and a m5d.large instance.
That gave me a much nicer number, although still far from what I wanted to have.
On the cloud machines, this takes about 23 - 25 seconds. Better than 12 minutes, but nothing to write home about.
One of the reasons that I wanted to write this blog post is specifically to go through this process, because there are a lot of things that matter, and it sometimes can be hard to figure out what does.
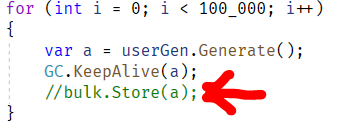
Let’s make a small change in my code, like so:
What this does is to remove the call to RavenDB entirely. The only cost we have here is the cost of generating the from the Bogus library. This time, the code completes in 13 seconds.
But wait, there are no RavenDB calls here, why does it take so long? Well, as it turns out, the fake data generation library has a non trivial cost to it, which impact the whole test. I changed things so that we’ll generate 10,000 users and then use bulk insert to send them over and over again. That means that the time that we measure is just the cost of sending the data over. With these changes, I got much nicer numbers:
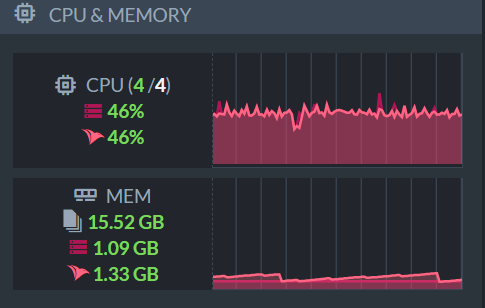
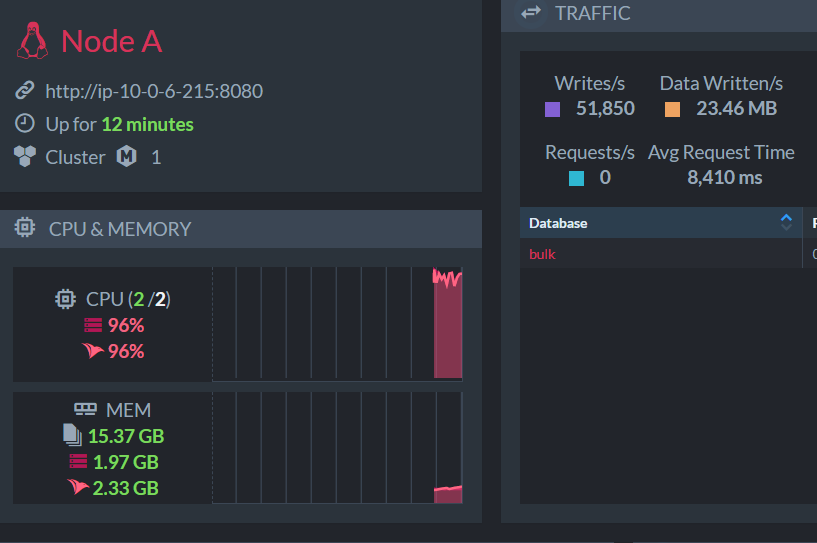
While this is going on, by the way, we have an interesting observation about the node while I’m doing this.
You can see that while we have two machines trying to push data in as fast as them can, we have a lot of spare capacity. This is key, actually. The issue is what the bottleneck, and we already saw that the problem is probably on the client. We improved our performance by over 300% by simply reducing the cost of generating the data, not writing to RavenDB. As it turns out, we are also leaving a lot of performance on the table because we are doing this single threaded. A lot of the time is actually spent on the client side, doing serialization, etc.
I changed the client code to use multiple threads and tried it again. By the way, you might notice that the client code is… brute forced, in a way. I intentionally did everything in the most obvious way possible, caring non at all about the structure of the code. I just want it to work, so no error handling, nothing sophisticated at all here.
This is with both client machines setup to use 4 threads each to send the data. It’s time to dig a bit deeper and see what is actually going on here. The t3.large machine has 2 cores, and looking into what it is doing while it has 4 threads sending data is… instructive…
The m5d.large instance also have two cores, and is in a similar state:
Leaving aside exactly what is going on here (I’ll discuss this in more depth later in this post), it is fairly obvious that the issue here is on the client side, we are completely saturating the machine’s capabilities.
I created another machine to serve as a client, this time a c5.9xlarge, an instance that has 36 cores and is running a much faster CPU that the previous instances. This time, I a single machine and I used just a single thread, and I got the following results:
And at the same time, the server resources utilization was:
Note that this is when we have a single thread doing the work… what happens when we increase the load?
Given the disparity between the client (36 cores) and the server (just 4), I decided to start slow and told the client to use just 12 threads to bulk insert the data. The result:
Now we are talking, but what about the server’s resources?
We got ourselves some spare capacity to throw around, it seems.
At this point, I decided to go all in and see what happens when I’m using all 36 cores for this. As it runs out, we can get faster, which is great, but the rise isn’t linear, unfortunately.
At this point, I mostly hit the limits. Regardless of how much load I put on the client, it wasn’t able to hit any higher than this. I decided to look at what the server is doing. Write speed for RavenDB is almost absolutely determined by the ACID nature of the database, we have to wait for the disk to confirm the write. Because this is such an important factor of our performance, we surface all of that information to you. In the database’s stats page, you can go into the IO Stats section, like so:
The first glace might be a bit confusing, I’ll admit. We tried to pack a lot of data into a single view.
The colors are important. Blue are writes to the journal, which are the thing that would usually hold up the transaction commit. The green (data write / flush) and red (sync) are types of disk operations, and they are shown here to allow you to see if there are any correlation. For example, if you have a big sync operation, it may suck all the I/O bandwidth, and your journal writes will be slow. With this view, you can clearly correlate that information. The brighter the color, the bigger the write, the wider the write, the more time it took. I hope that this is enough to understand the gist of it.
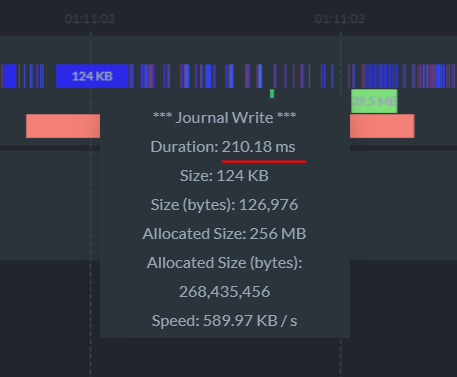
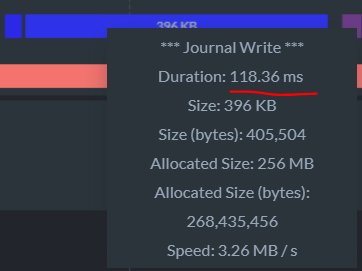
Now, let’s zoom in. Here you can see a single write, for 124KB, that took 200ms.
Here is another one:
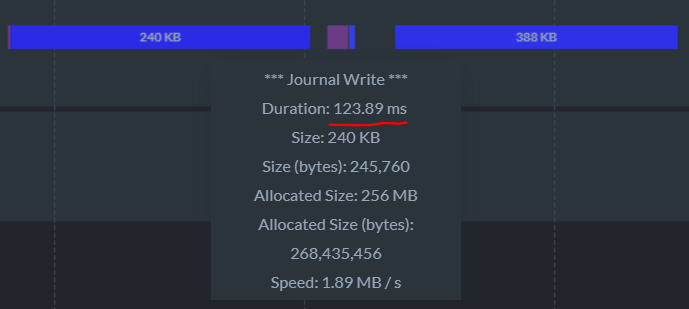
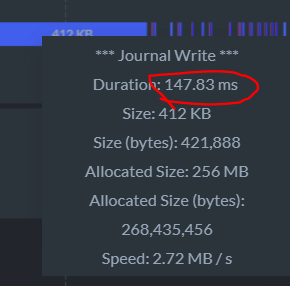
These are problematic for us, because we are stalling. We can’t really do a lot while we are waiting for the disk (actually, we can, we start processing the next tx, but there is a limit to that as well). That is likely causing us to wait when we read from the network and in likely the culprit. You might have noticed that both slow writes happened in conjunction with the sync (the red square below), that indicate that we might have latency because both operations go to the same location at the same time.
On the other hand, here is another section, where we have two writes very near one another and they both very slow, without a concurrent sync. So the interference from the sync is a theory, not a proven fact.
We can go and change the gp2 drive we have to an io1 drive with provisioned IOPS (1536, same as the gp2). That would cost me 3 times as much, so let’s see if we can avoid this. Journals aren’t meant to be forever. They are used to maintain durability of the data, once we synced the data to disk, we can discard them.
I created an 8 GB io2 drive with 400 IOPS and attached it to the server instance and then set it up:
Here is what this ended up as:
Now, I’m going to setup the journals’ directory for this database to point to the new drive, like so:
And now we have a better separation of the journals and the data, let’s see what this will give us? Not much, it seems, I’m seeing roughly the same performance as before, and the IO stats tells the same story.
Okay, time to see what we can do when we change instance types. As a reminder, so far, my server instance was t3a.xlarge (4 cores, 16 GB). I launched a r5d.large instance (2 cores, 16 GB) and set it up with the same configuration as before.
- 512 GB gp2 (1536 IOPS) for data
- 8GB io2 (400 IOPS) for journals
Here is what I got when I started hammering the machine:
This is interesting, because you can see a few discrepancies:
- The machine feels faster, much faster
- We are now bottleneck on CPU, but note the number of writes per second
- This is when we reduced the number of cores by half!
That seems pretty promising, so I decided to switch instances again. This time to i3en.xlarge instance (4 cores, 30GB, 2 TB NVMe drive). To be honest, I’m mostly interested in the NVMe drive ![]() .
.
Here are the results:
As you can see, we are running pretty smoothly with 90K – 100K writes per second sustained.
On the same i3en.xlarge system, I attached the two volumes (512GB gp2 and 8GB io2) with the same setup (journals on the io2 volume), and I’m getting some really nice numbers as well:
And now, the hour is nearing 4AM, and while I had a lot of fun, I think this is the time to close this post. The factor in write performance for RavenDB is the disk, but we care a lot more about latency than throughput for these kind of operations.
A single t3a.xlarge machine was able to hit peak at 77K writes/second and by changing the instance type and getting better IO, we were able to push that to 100K writes/sec. Our current benchmark is sitting at 138,000 writes/second, by the way, but it isn’t running on virtual machine but on physical hardware. Probably the most important part of that machine is the fact that is has an NVMe drive (latency, again).
However, there is one question that still remains. Why did we have to spend so much compute power on generating the bulk insert operations? We had to hit the server from multiple machines or use 36 concurrent threads just to be able to push enough data so the server will sweat it.
To answer this, I’m going to do the Right Thing and look at the profiler results. The problem is in the client side, so let’s profile the client and see what is taking so much computation horse power. Here are the results:
The cost here is serialization is the major factor here. That is why we need to parallelize the work, otherwise, as we saw, RavenDB is basically going to sit idle.
The reason for this "issue" is that JSON.Net is a powerful library with many features, but it does have a cost. For bulk insert scenarios, you typically have a very well defined set of documents, and you don't need all this power. For this reason, RavenDB exposes an API that allow you to fully control how serialization works for bulk insert:
DocumentStore.Conventions.BulkInsert.TrySerializeEntityToJsonStream
You can use that to significantly speed up your insert processes.















Comments
Oren, thanks for this blog post. Very informative and useful!
I went ahead and tried to break this 100k writes/s barrier I've been hitting in my benchmarks.
Good news is that I could break it and hit 200k writes/s. However, the journey was not very straightforward.
The best result so far was ~100k writes/s on Azure servers - standalone dedicated DB server with NVMe storage (200k write iops) and separate compute server which fed data to this DB server. When I added a second server, the write speed stayed the same and the clients were not fully utilized, so the client throughput was not the bottleneck anymore.
Okay, what could be the bottleneck here?
You mentioned in the post that on physical hardware, the limit is higher. Let's try this on bare metal.
My laptop has NVMe SSD with around 160k iops random write capacity. We connected by coworker's PC (6 cores/12 threads CPU) over a gigabit network (100 Mbps was a limiting factor here), and ran the benchmark again. 100k writes/s again.
Okay, what could be the bottleneck here?
Screw persistent storage and let's go to RAM. I set up a ramdisk which I used as database storage on the Azure VM and ran the benchmarks again. (I needed to format a file on the ramdisk as RavenDB refused to create journal files directly on the ramdisk, if anyone would like to try this.) 100k writes/s again.
Okay, what could be the bottleneck here?
Taking a look at IO Stats chart, we noticed an intriguing pattern: The journal writes were extremely fast and short, and there were gaps between all of them, both when the storage was NVMe and RAM - it was more pronounced when storing to ramdisk. Seems like the disk storage is no longer the bottleneck. In this particular case, the database stores the data in a single thread, where the iops capacity is much lower. 30k iops on my laptop, 25k iops on the Azure VM.
I ran the benchmark on two databases in parallel. One server pushed the data to one database, the other server to another database. The performance was a little bit better - 100k writes/s and a change. Not pinned to 100k anymore but not much better. Also, the servers generating the data started to slack off.
Okay, what could be the bottleneck here?
Turns out that the network between the Azure VMs was saturated now, at around 40 MB/s (400 Mbps). Back to bare metal and direct gigabit connection!
I set up two databases on my laptop and the other PC started to shove the data in parallel. Much to our delight, the write rate was around 200k writes/s! The storage capacity was finally being used. When we tried to add a third database, the speed didn't really increase and the laptop started throttling (thermal design is not the best on this one) so we didn't really care to continue.
Anyway, in this particular scenario - bulk inserting to one database - the 100k writes/s limit probably won't get any better. However, it's pretty good speed, especially as I started at around 15k with my attempts :-). In other scenarios - multiple imports, ordinary operation etc. - the write capacity is higher, which is good to know.
Again, thanks for the story.
Andrej,
Yes, a single database limit is the speed in which the transaction merger can operate. That is partly I/O, but also computation.
We do some parallelism there, but a large part of it is the fact that we are single write per db, so that translate to a natural bottleneck (and greatly simplified architecture).
The good news here is that it make it simple to increase performance if you can push data to multiple databases.
At any rate 100K / sec is usually good enough for most needs unless you are dealing with initial data load.
Yes Oren, exactly. Initial data load (and perhaps repeated data load of large quantities of data) is one of the scenarios we are investigating so that's why we are optimizing for this use case. We probably can't separate the data to multiple databases so this limit is very good knowledge.
Does the import data from a RavenDB 3.x need to reach numbers anywhere near here, or is this not optimised as it is a one-time cost?
I am asking this because we are trying to figure out how version 4.2 (with x cores) performs when compared to 3.5 because of the license change from server to core which would mean about a 12 times increase of price (3 servers with basically 4 cores) without any code changes at this moment.
But we are only seeing about max 2.000 inserts/sec (some documents are large like >10MB)
Christiaan,
It is very likely that you are running into network / IO issues here.
2,000 docs / sec x even 128KB avg gives us ~200MB / sec.
Note that the import from 3.x is designed to be repeatable. It is expected that the first time will take a while, then you re-run it and it gets only the data since the last update, etc.
Are you considering using the new System.Text.Json on .Net Core 3.0?
svick,
We are looking forward to testing this.
The problem is that on the server side, we already have our own parser, which is likely on par or faster. That is going to be great to test.
There are also compatibility concerns to look at.
I'm wondering whether you considered supporting some sort of binary/alternative data format for clients that are capable of it via content-negotiation?
To look beyond .net, Jackson (JVM clients) for example supports smile, cbor and some other things: https://github.com/FasterXML/jackson-dataformats-binary
They appear to be a least somewhat of a "standard". Not sure what the best option is here.
Or provide a blittable wire-format & client libraries? Or is there already support for this on non-.net clients?
DocumentStore.Conventions.BulkInsert.TrySerializeEntityToJsonStreamis not available on JVM client for example.Johannes,
Blittable isn't an easy format to work with. It was designed for zero copy work against memory mapped data.
Note that in terms of parsing JSON, this is mostly solved. We have a JSON parser that can go through quite a lot of text quite quickly.
It is a specific issue of generating the JSON using json.net that is costly, because that library is optimized for features, not speed.
There are other options available that are faster, but in general, we want to use a text based format because it is so much more readable.
Comment preview