Graphs in RavenDBGraph modeling vs. document modeling
One of the most important design decisions we made with RavenDB is not forcing users to explicitly create edges between documents. Instead, the edges are actually just normal properties on the documents and can be used as-is. This means that pretty much any existing RavenDB database can immediately start using graph operations, you don’t need to do anything.
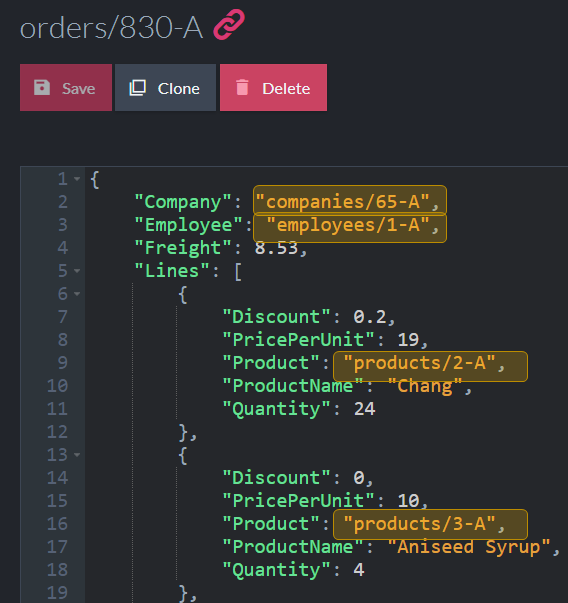
The image below shows an order, using the RavenDB’s sample Northwind dataset. The highlighted portions mark the edges from this document. You can use these to traverse the graph by hopping from document to document.
For example, using:
This is easy to do, migrates well (zero cost to do so, yeah!) and usually matches nicely with what you already have. It does lead to an interesting observation. Typically, in a graph DB, you’ll model everything as a graph. But with RavenDB, you don’t need to do that.
In particular, let’s take a look at the Neo4J’s rendition of Northwind:
As you can see, everything is modeled as a node / edge. This is the only thing you could model it as. With RavenDB, you would typically use a domain driven model. In this case, it means that a value object, like an OrderLIne, will not have its own concrete existence. Either as a node or an edge. Instead, it will be embedded inside its root aggregate (the order).
Note that this is actually quite interesting, because it means that we need to be able to provide the ability to query on complex edges, such as the order lines. Here is how works:
This will give us all the discount products sold in London as well as their discount rate.
Note that in here, unlike previous queries, we use an named alias for the edge. In this case, it gives us the ability to access it properties and project the line’s Discount property to the user. This means that you can have a domain model with strong cohesion and locality, following the domain driven design principles while still being able to run arbitrary graph queries on it. Combining this with the ability to pull data from indexes (including map/reduce) ones, you have a lot of things that you can do that used to be very hard but now are easy.
More posts in "Graphs in RavenDB" series:
- (08 Nov 2018) Real world use cases
- (01 Nov 2018) Recursive queries
- (31 Oct 2018) Inconsistency abhorrence
- (29 Oct 2018) Selecting the syntax
- (26 Oct 2018) What’s the role of the middle man?
- (25 Oct 2018) I didn’t mean to build this feature!
- (22 Oct 2018) Query results
- (21 Sep 2018) Graph modeling vs. document modeling
- (20 Sep 2018) Pre-processing the queries
- (19 Sep 2018) The query language
- (18 Sep 2018) The overall design


Comments
So instead of declaring the edges, ravendb will create them on the fly as they are queried, similar to how indexes are create dynamically?
Peter, The idea is that how RavenDB deals with the edges and such queries is an internal implementation detail, not something that is explicitly and externally exposed.
I liked how the design is going! Good work, Oren!
Just some questions: How will you implement that on the server? Will you keep the transversed documents on memory? How do you plan to work with big graphs or this is out of the scope?
I can see how
{
  Company: “companies/65-A”
}
is treated automatically as an edge, but how do you think to model relationships with additional data?
Daniel, All of this is happening on the server side. We plan for large graphs, but the current work is primarily on validation of the approach and ensuring that we can actually provide the right answers. One of the design goals is to not force us to a particular impl. That said, we are using mmap data behind the scenes, so assuming reasonable working sets sizes, that should be pretty fast.
Njy, Yes, that is the idea. For more complex things, we have:
[l:Lines(Discount > 0).Product]The parts of this are:
Lines- That is the root property name(Discount > 0)- that is the filter for the link.Productspecify the property where the actual document id is located.This is an interesting approach. So if in a graph database we create edges for various use cases IE:
Product->ReccomendedWith->ProductHow should this be modeled in Raven? By adding a new navigation property to the Product document or by creating an intermediary document likeproduct recommendationswhich contains the navigation?Pop, You'll have a
"RecommendWith": ["products/1-A", "products/3-C"]That seems to be the easiest way to do that.Comment preview