RavenDB 4.1 FeaturesDetailed query timing details
Queries are one of the most important things you do in RavenDB, and analyzing queries to understand their costs is an important step in many optimization tasks.
I’m proud to say that for the most part, you don’t need to do this very often with RavenDB. Usually the query optimizer just works and give you query speed that is fast enough that you don’t care how this is achieved. With RavenDB 4.1, we made it even easier to figure out what are the costs of the query. Here is a good example:
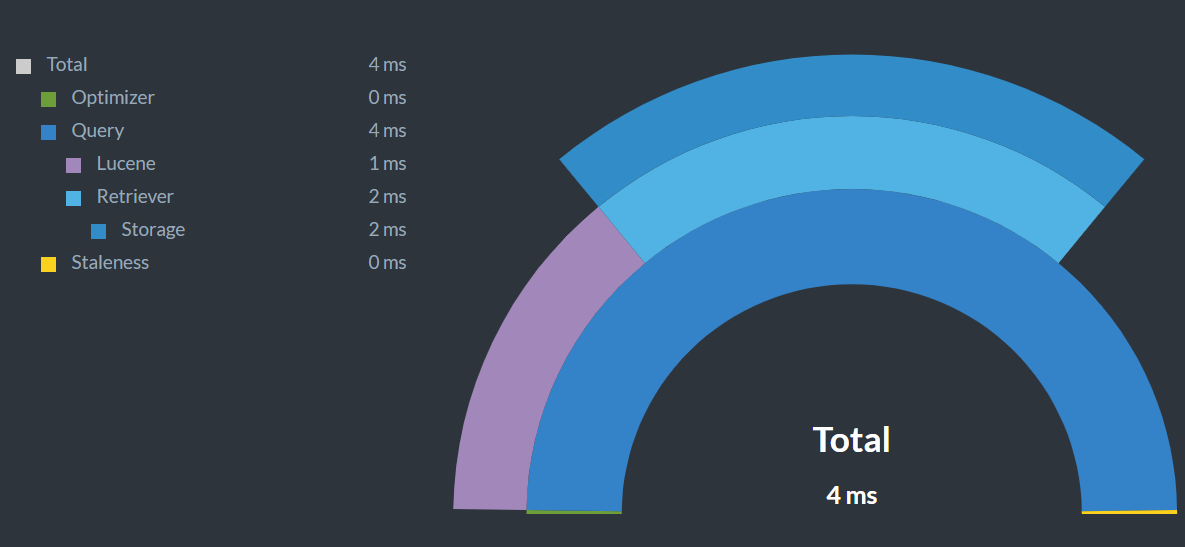
With the inclusion of “include timings()”, RavenDB will provide you with detailed stats on the costs of the relevant pieces in the query. The output in the studio looks like this:
You can see in a glance exactly how much time RavenDB spent on each part of your query. Armed with that information, you can set out to improve things a lot faster (pun intended).
More posts in "RavenDB 4.1 Features" series:
- (22 Aug 2018) MongoDB & CosmosDB Migration Wizards
- (04 Jul 2018) This document is included in your subscription
- (03 Jul 2018) Detailed query timing details
- (02 Jul 2018) Of course I know ya, dude
- (29 Jun 2018) Running RavenDB embedded
- (26 Jun 2018) Can you explain that choice?
- (20 Jun 2018) Cluster wide ACID transactions
- (19 Jun 2018) Explain that choice
- (22 May 2018) Highlighting
- (11 May 2018) Counting my counters
- (10 May 2018) JavaScript Indexes
- (04 May 2018) SQL Migration Wizard


Comments
Comment preview