What is new in RavenDB 3.0Operations–production view
One of the most challenging things to do in production is to know what is going on? In order to facilitate that, we have dedicate some time to exposing the internal guts of RavenDB to the outside world (assuming that the outside world has the appropriate permissions).
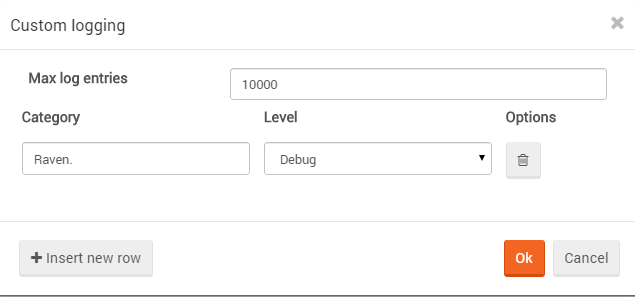
One way to look at that is to subscribe to the log stream from RavenDB, you can do it like this:
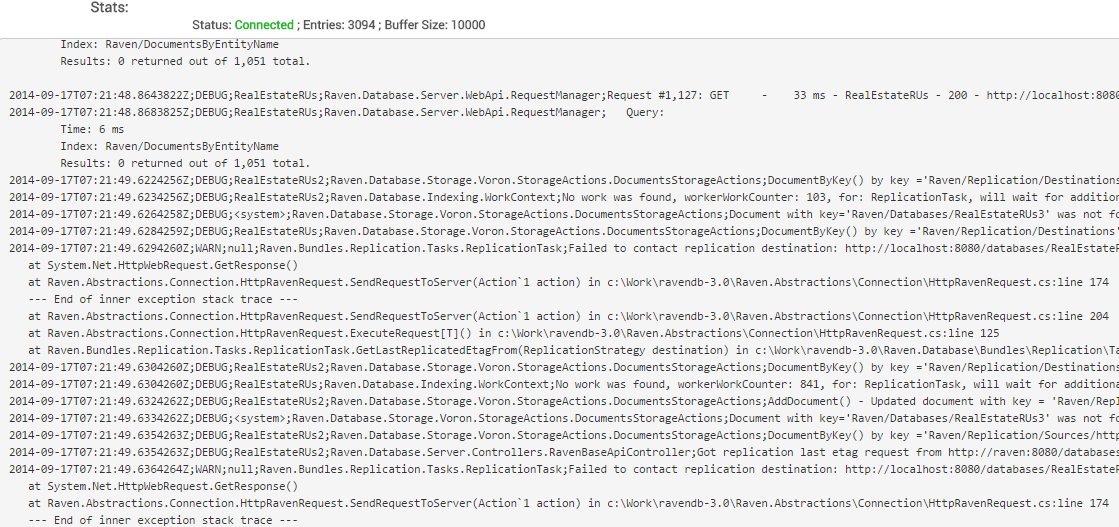
This gives you the following:
Note that this requires no configuration changes, or restarting the server or database. As long as your logs subscription is active, we’ll send you a live stream of all the log activity in RavenDB, which should allow you to get a lot of useful insights about what exactly it is that RavenDB is doing.
This is especially important if you need to do any sort of trouble shooting, because that is when you need to have logs, and restarting the server to enable them is often out of the question (it would likely resolve the issue you want to understand). And honestly, this is a feature that we need to support customers, it is going to be much easier to just say “let us look at the logs”, rather than having to go over how to configure them, etc. Another thing to note is the fact that this can all be done remotely, you don’t have to have access to the physical server. It does require you to have admin permissions on the server, so not any user can do that.
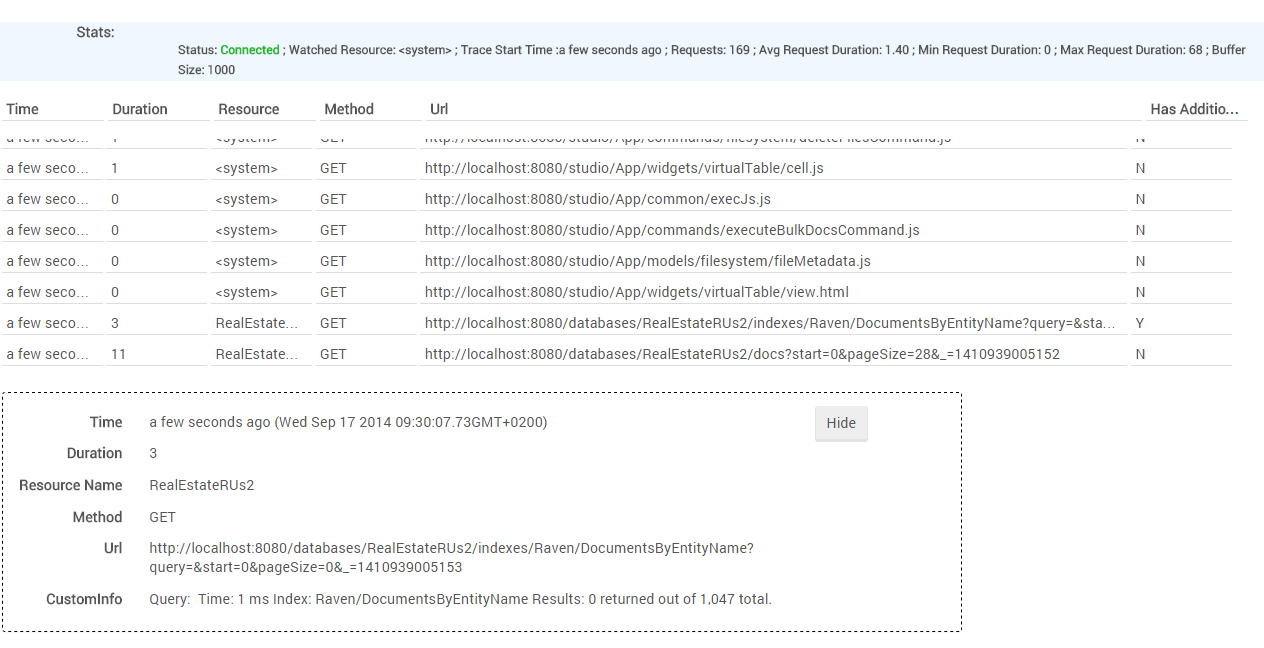
Another production view that is available to you is the Traffic Watcher:
This gives you the option of looking at the requests that are actually hitting the server. It is a subset of information from the logs, but it is usually a lot more interesting to watch. And again, this can be done remotely as well. You can watch all databases, or just a single one.
But most importantly from support perspective is the new Debug Info! package. And yes, it deserver the bang in the name. What this does is gather a lot of important information from the database, all the current stats, and a lot of stuff that we need to figure out what is going on. The idea is that if you have a problem, we won’t have to ask for a lot of separate pieces of information, you can get it all as a single shot.
Oh, and we can also grab the actual stack trace information from your system, so we even know exactly what your system is doing.
In my next post, I’ll discuss one last operational concern, optimizations.
More posts in "What is new in RavenDB 3.0" series:
- (24 Sep 2014) Meta discussion
- (23 Sep 2014) Operations–Optimizations
- (22 Sep 2014) Operations–the nitty gritty details
- (22 Sep 2014) Operations–production view
- (19 Sep 2014) Operations–the pretty pictures tour
- (19 Sep 2014) SQL Replication
- (18 Sep 2014) Queries improvements
- (17 Sep 2014) Query diagnostics
- (17 Sep 2014) Indexing enhancements
- (16 Sep 2014) Indexing backend
- (15 Sep 2014) Simplicity
- (15 Sep 2014) JVM Client API
- (12 Sep 2014) Client side
- (11 Sep 2014) The studio
- (11 Sep 2014) RavenFS
- (10 Sep 2014) Voron


Comments
Glad to see this is finally here.
Comment preview