Benchmarking: Slow is fast, fast is slow
I’m trying to compare indexing speed of Corax vs. Lucene. Here is an interesting result:
We have two copies of the same index, running in parallel on the same data. And we can clearly see that Lucene is faster. Not by a lot, but enough to warrant investigation.
Here is the core of the work for Lucene:
And here it is for Corax:
If you look at the results, you’ll see something really interesting.
For the Corax version, the MapItems.Execute() is almost 5% slower than the Lucene version.
And that really pisses me off. That is just flat out unreasonable to see.
And the reason for that is that the MapItems.Execute() is identical in both cases. The exact same code, and there isn’t any Corax or Lucene code there. But it is slower.
Let’s dig deeper, and we can see this interesting result. This is the Lucene version, and the highlighted portion is where we are reading documents for the indexing function to run:
And here is the Corax version:
And here it is two thirds more costly? Are you kidding me? That is the same freaking code and is utterly unrelated to the indexing.
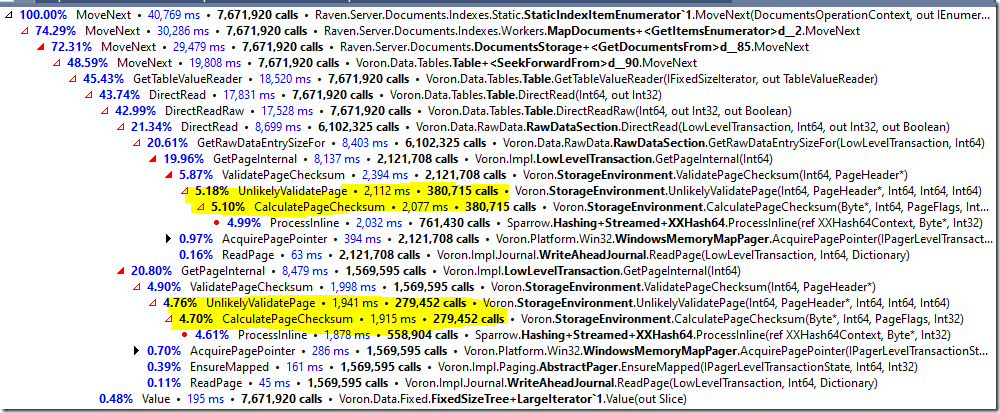
Let’s dig deeper, shall we? Here is the costs breakdown for Lucene, I highlighted the important bits:
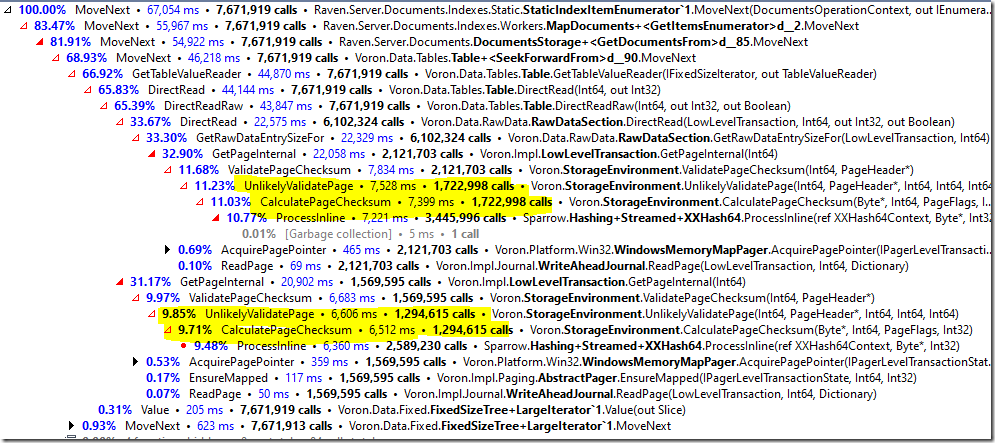
And here is the cost breakdown for Corax
I have to explain a bit about what is going on here. RavenDB doesn’t trust the disk and will validate the data it reads from it the first time it loads a page.
That is what the UnlikelyValidatePage is doing.
What we are seeing in the profiler results is that both Corax and Lucene are calling GetPageInternal() a total of 3.69 million times, but Corax is actually paying the cost of page validation for the vast majority of them.
Corax validated over 3 million pages while Lucene validated only 650 thousand pages. The question is why?
And the answer is that Corax is faster than Lucene, so it is able to race ahead. When it races ahead, it will encounter pages first, and validate them. When Lucene comes around and tries to index those documents, they were already validated.
Basically, Lucene is surfing all the way forward on the wavefront of Corax’s work, and ends up doing a lot less work as a result.
What this means, however, is that we need to test both scenarios separately, on cold boot. Because otherwise they will mess with each other results.


Comments
With such big number pf method calls, do you take into the consideration effect of observing (profiler) when checking if something is fast or slow?
Are there any other benefits to Corax besides performance? I was not able to able any documentation except for some posts from 8 years ago.
Well, if you want to compare the performance of two methods, don't run them in parallel.
Abc,
Yeah, we are running the scenarios both in and out of the profiler.For that matter, we are running multiple profiler types (memory, CPU, etc).We are watching I/O, memory and compute, the whole thing.
I find that running in the profiler gives me insight into what is actually happening. But I don't actually care about the numbers there.There have been scenarios where the profiler has changed things significantly, but I haven't run into an issue with the profiler impact changing the actual weights for actions.
My role in this is typically algorithm / approach. We have other team members that go into VTune, etc. They optimize at the assembly level, once the big ticket stuff are done.
Dmitry,
Corax is meant to be all about performance. It isn't ready yet as a feature, I'm just discussing the development of it in the current time.
Rauhotz,
The whole idea is that they should be isolated from one another. There isn't any shared state, and they are running in their own threads. There shouldn't be an impact.
Note that running them in parallel half the time we have to wait for the results, as well :-)
Have you considered to use ETW to profile your workload tests? On the pro side you can let it run, and when something happens you already have the profiling data at hand. You can identify hot called methods with LBR CPU tracing, but that needs a physical machine with no HyperV running. That can give you a lower estimate of the call count without any instrumentation at binary level.
Alois,
I don't actually have a problem getting the numbers. Running that in the profiler gives me great details.
And to my knowledge, dotTrace uses ETW, just make it far easier :-)
I mean that using a UI might not be always the best approach if you want to profile continuously. See https://aloiskraus.wordpress.com/2022/07/25/pdd-profiler-driven-development/ what I mean. The dotTrace UI is great, but sometimes you want to look at the system as a whole, to check if NTFS states, AV scanners or other things are happening on that machine.
Alois,
Oh, I see what you mean, that is a really good point. And I really liked the blog post.
That said, the focus right now isn't so much on interaction with the rest of the system, but interactions inside the system. The work you described was already done (mostly) on Voron development time. Now we are sitting on top of that, we don't worry overmuch about the topic.
Ahh ok. Besides system testing this approach also works in the field by getting ETW data and analyzing it with the tools we have now. Especially stacktags are a great way to identify AV slowdowns pretty quick. Disabling AV software is not reliable. I also had the case that exclusion rules were overruled by Defender. The things you configure are not always the ones which are executed.
Comment preview