RavenDB Grafana Data Source
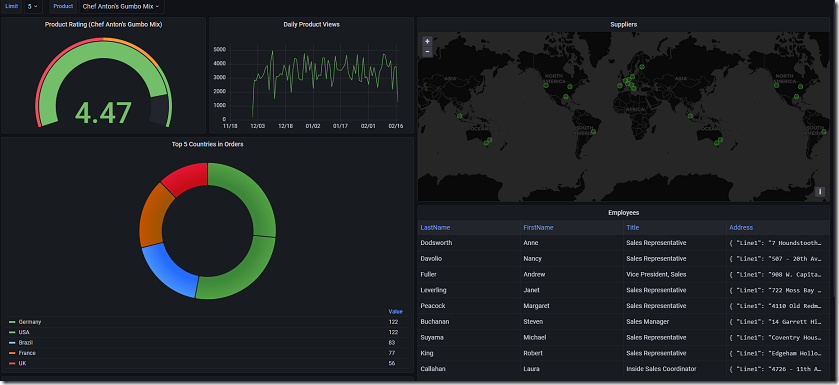
I’m happy to announce that we have released v1.0 of RavenDB’s Grafana Data Source. This RavenDB data source plugin allows you to query and visualize your RavenDB data in Grafana. Note that this is distinct from monitoring RavenDB itself in Grafana (which is also possible, of course, see here).
You can see what this looks like here:
For more details, see the detailed guide.


Comments
Could this be the missing piece I was looking for to start using RavenDB as a sink for Serilog?
I develop middleware services for integrating ERP systems with our CAD/CAM application and logging has been a huge pain for me and the end users. To this date I'm still using a file logging framework made in-house, and for the end users that is terrible because there is no way for them to know the status of the service other than going into server and looking through the files.
Luri,
That may certainly be the case. Serilog + RavenDB are easy enough, see: https://github.com/ravendb/serilog-sinks-ravendb
And then you can expose that to Grafana directly or after processing.
Comment preview