Seeking feedback on the RavenDB Cluster Dashboard
I am really proud with the level of transparency and visibility that RavenDB gives out of the box to its users. The server dashboard gives you all the critical information about what a node is doing and can serve as a great mechanism to tell at a glance what is the health of a node.
A repeated customer request is to take that up a notch. Not just showing a single server status, but showing the entire cluster state. This isn’t a replacement for a full monitoring solution, but it is meant to provide you with a quick overview of exactly what is going on in your cluster.
I want to present some early prototypes of how we are thinking about showing this information, and I wanted to get your feedback about those, as well as any other information that you think should be relevant for the cluster dashboard.
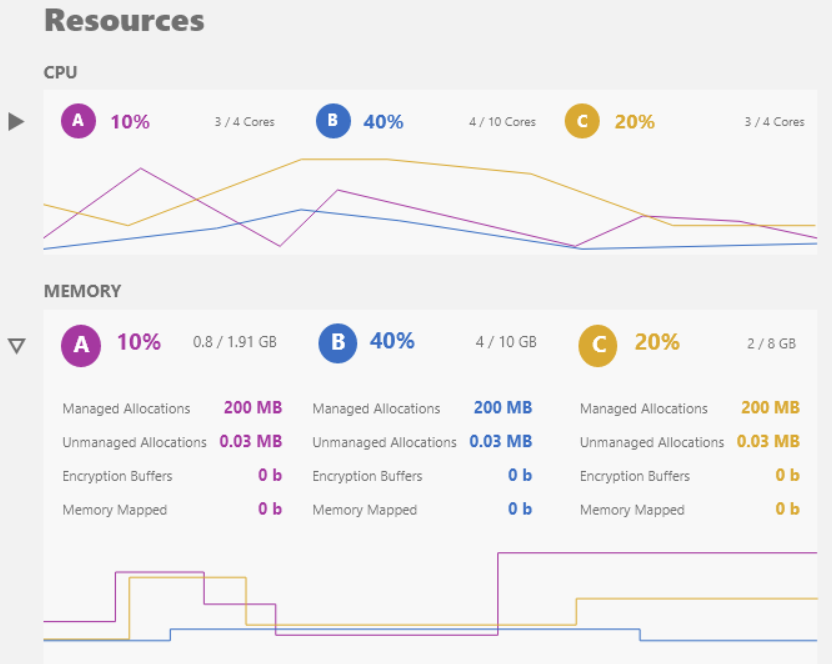
Here is the resource utilization portion of the dashboard. We aren’t settled yet on the graphs, but we’ll likely have CPU usage and memory (including memory breakdowns).
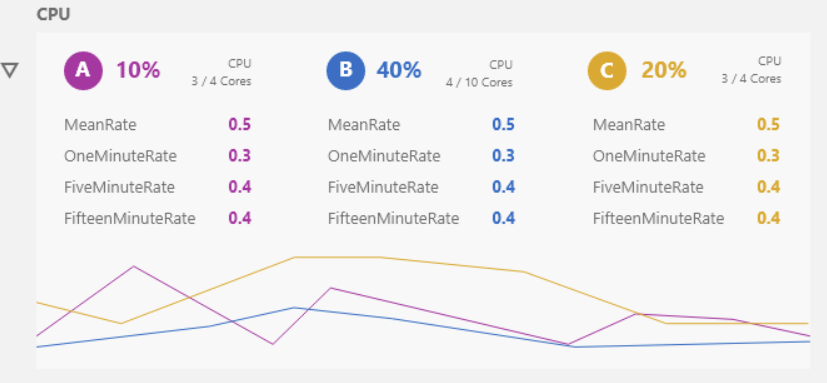
Some of this information may be hidden by default, and you can expand it:
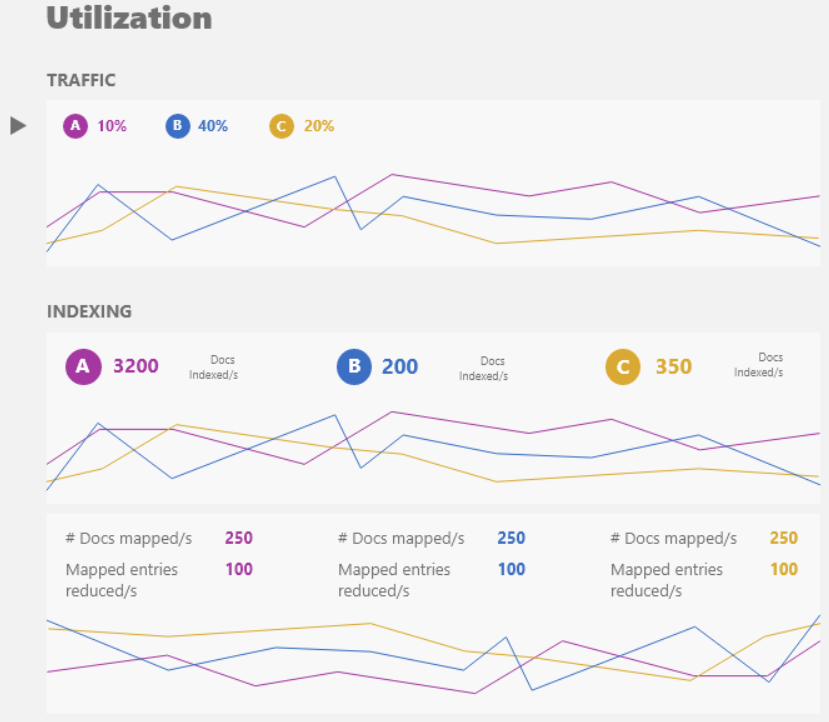
You can get more details about what the cluster is doing here:
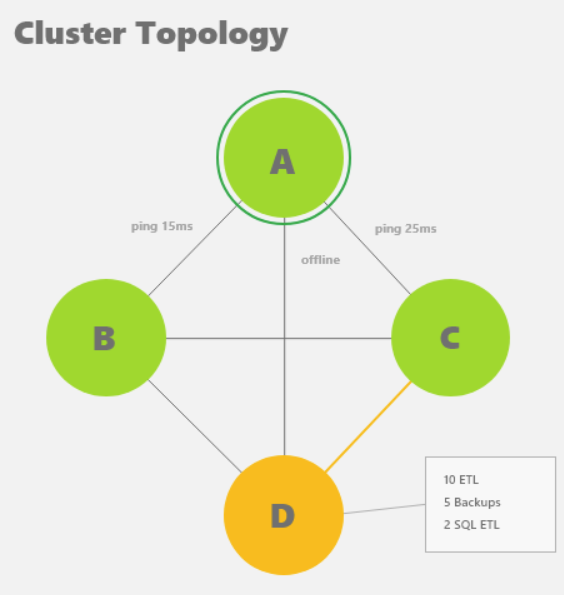
And finally, the overall view of task assignment in the cluster:
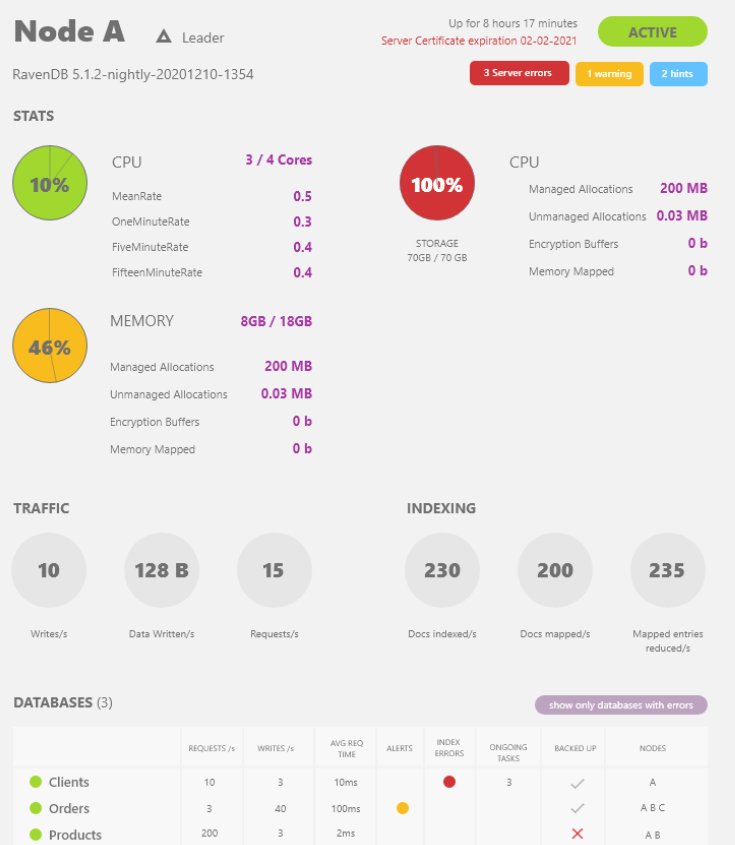
You can also drill down to a particular server status:
This is early stages yet, we pretty much have just the mockup, so this is the right time to ask for what you want to see there.


Comments
I like this, it's helpful to see everything in one place.
I think something that would be helpful as well would be where we can see the document counts for a particular collection (or records in an index) across all three servers (and historical if possible!); if you have indices that are constructing documents, then this is a good indicator of health as well.
As an example, there may have been a processing issue on one node in the cluster, but that node doesn't get hit for queries, yet; seeing the document counts and whether or not they are consistent across nodes would be helpful in ensuring there are not time bombs that might go off.
Comment preview