Building extendible hash leaf page–Part III, optimization phase
In the previous post, I wrote about how I changed the structure of the hash leaf page to increase data density. I managed to get it down to 32MB range when I’m using random keys. That is a pretty great number, for memory usage, but what is the cost in terms of performance?
Well, let’s figure it out, shall we?
I added some tracing code and got the first result:
3.124000 us/op with 32.007813 MB
That is not to shabby, right? Let’s see where we are spending most of our time, shall we? I opened the profiler and got:
Okay, that is a good point, isn’t it? Changing to release mode gives us:
1.471000 us/op with 32.007813 MB
that is much nicer, but still, profiler please…
As a side note, it actually takes less time to run the profiler than for it to analyze its output. I was looking at this for a while.
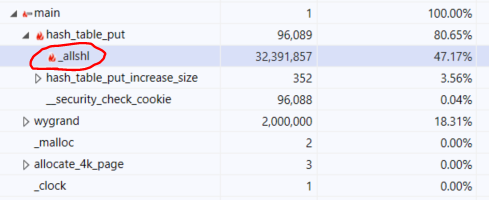
The result was… stunning:
What is this thing? And why did it take almost 50% of my runtime?
As it turns out, I was compiling for x86, and I’m using a lot of shifts on 64 bits numbers. This _allshl seems to be part of the x86 runtime. That means that what I expected to be a cheap instruction on a register was actually a method call.
That is interesting, but easy to fix. When running in Release/x64, we get the following results:
0.723 us/op with 32.007813 MB
Okay, so we are under a microsecond per op, and very reasonable memory, good to go, right?
Well, remember that I did absolutely zero optimizations so far? What does the profiler tell us now? Here is an interesting hotspot:
That is reasonable, we are benching this method, after all. But inside that method, we see:
This is the part where we scan an existing piece to see if the value is inside it or not. This tell us if we need to add a new value or update an existing one. It make sense this will be hot, we have to do it on each put to the data related to the piece where we want to put the new key.
There are a few ways to deal with this, we can try to move from the simple varint mode to a more complex (and performant) system. StreamVByte would probably be a good solution, in term of raw performance. But it is meant for 32 bits numbers and doesn’t play nice with being able to remove and add values from the stream easily.
I could also try to play games, instead of calling this function twice, call it once and pass both k and v. However, that is almost assuredly a false play. The varint method is small enough that it doesn’t really matter, the compiler can inline it and play its own optimizations. Also, I tried it and there was no noticeable performance change, so that’s down.
Another way to deal with it is to reduce the number of times we call this function. And here is where things get interesting. Why is this called so much? Because during the put process, we find a page to put a value, then in that page, we find a piece (a 64 byte range) that we will put the key and value in. When we get to the piece, we need to check the already existing data if the key is there or not. So far, so good, but there is another factor to consider, overflows.
A piece may overflow and spill into consecutive pieces. After all, that is what allowed us to reduce the memory usage from 147MB to just 32MB in the random integers scenario. However, that also means that we may need to scan much larger piece of the page. That explains why we are seeing so much usage of the decoding function.
Let’s look at the previous behavior, where we have no overflow at all?
0.551000 us/op with 147.320313 MB
That is a much cheaper cost, but much higher memory. It looks like the typical compute vs. memory cycle, but let’s look at the actual costs?
You’ll notice that we spend most of our time on increasing the hash table size, allocating and moving memory, etc. So even though we are faster, that isn’t a good option for us.
One thing to note, we are looking for the same key, and decoding all the data to find it. But we don’t actually need to do that, we already have the key, and encoded it to its varint form. We can do a search on the raw encoded data to find it. It won’t be good enough for the positive case (we may have a value that was encoded to the same form), but it should help for the common case of inserting a new value. If we find something with memmem(), we still need to decode the data itself and see if the pattern we found is a key or a value, but that should help.
I tested it using GCC’s implementation, and the performance dropped by almost 50%, it took 1.3 us/op! Maybe if I was using a SIMD optimized implementation, that would help, but given the kind of data we are looking for, it didn’t pan out.
Another option is to reduce the number of times we’ll try to overflow a value. Right now, if we can’t put a value in its proper place, we’ll try putting it in any of the other locations. That means that we may probe as many as 127 pieces. It also means that during put, we have to scan overflow chains. As we saw in the previous post, that can add up to scanning up to 1.8 KB of data for a single put. What happens if we limit the overflow amount?
Let’s see if we limit the overflow to 32 probes. Now it only takes 0.403 us/op, which is a huge improvement. But what about the memory size? It’s easier to look things up as a table:
Max chain Overall Time (sec) us/op Size (MB) 1 0.545000 0.545000 147.320313 2 0.359000 0.359000 75.156250 4 0.372000 0.372000 55.523438 8 0.322000 0.322000 36.882813 16 0.336000 0.336000 32.226563 32 0.448000 0.448000 32.007813 64 0.596000 0.596000 32.007813 128 0.770000 0.770000 32.007813
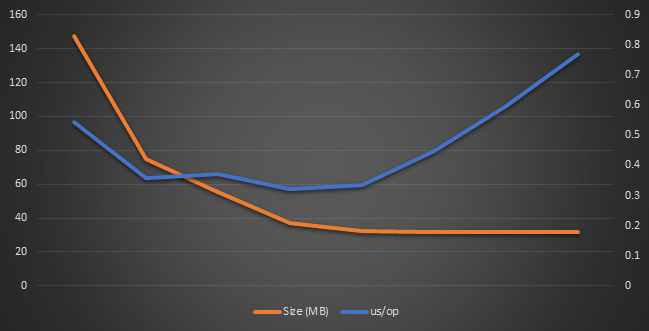
These numbers are interesting, but let’s look at them as a graph, shall we?
We can see that the size drops sharply as the performance is best between 8 and 16 probe attempts, and all we are left choosing is the memory cost.
If we go with 8 probe attempts, we’ll pay with additional 4.875 MB, but with 16 probe attempts, we’ll use just 224KB more with a cost of 0.044 us/op more than the optimal value.
We could go to 32, of course, which gives us optimal size, with about 60% of the cost of doing the full scan. However, by paying just 224KB more, we get down to 43% of the initial cost. And that certainly seems like it is worth it.
You can find the full source code (a little bit cleaned up) here.


Comments
Comment preview