What did all this optimization give us?
I’ve been writing a lot about performance and optimizations, and mostly I’m giving out percentages, because it is useful to compare to before the optimizations.
But when you start looking at the raw numbers, you see a whole different picture.
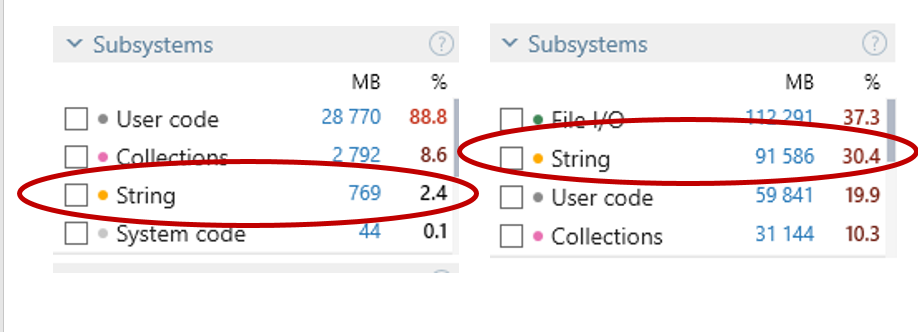
On the left, we have RavenDB 4.0 doing work (import & indexing) over about 4.5 million documents. On the right, you have RavenDB 3.5, doing the same exact work.
We are tracking allocations here, and this is part of a work we have been doing to measure our relative change in costs. In particular, we focused on the cost of using strings.
A typical application will use about 30% of memory just for strings, and you can see that RavenDB 3.5 (on the right) is no different.
On the other hand, RavenDB 4.0 is using just 2.4% of its memory for strings. But what is even more interesting is to look at the total allocations. RavenDB 3.5 allocated about 300 GB to deal with the workload, and RavenDB 4.0 allocated about 32GB.
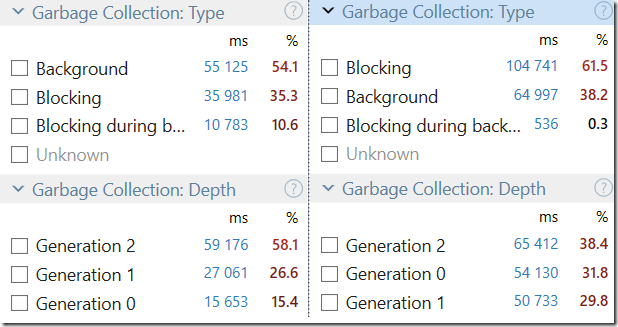
Note that those are allocations, not total memory used, but on just about every metric. Take a look at those numbers:
RavenDB 4.0 is spending less time overall in GC than RavenDB 3.5 will spend just on blocking collections.
Amusingly enough, here are the saved profile runs:


Comments
Great job. All those optimizations are really paying off.
Now if only 4.0 could be in officially release for production so that we can all benefit from this ;-) Any ETA? I'm rewriting a performance sensitive part of our software using ravendb and performance from 4.0 would really help in proving I didn't make a mistake going with ravendb :D
Which profiler(s)/tools do you use to produce your results for these optimization posts. Does the profiling tool you use provide the charts above in this post?
So... What is the difference in total runtime? Missing the most important metric ;-)
What is your experience with the JetBrains profilers versus Visual Studio profilers?
Philippe ,
We are talking about 6 - 9 weeks before a beta release is out.
Tom,
We use dotTrace for pretty much everything.
Johannes,
Consider the fact that we are talking about a minimum of 10x faster performance across the board, and sometimes much higher.
Wow, 10x is super impressive! Glad to see how all the big ticket items and all the micro optimizations add up to an order of magnitude increase in performance. Curios to see 4.0 pitted against 3.5 in a few typical scenarios... :-)
Early versions of ravendb suffered from quite a few data corruption issues. How will you make sure that 4.0 doesn't go through the same growing pains after such a massive rewrite?
Eric,
We are doing several things at once to mitigate this issue.
First, we have a set of tests that are aimed at discovering any such issues, as well as the whole suite that indirectly test them.
Second, we are running tests by an independent team that are meant to discover things that the dev team didn't think of.
Third, we have introduced several features (checksums, for example) that are meant to ensure data integrity.
Forth, typical deployment is going to run on multiple node for HA, so you always have a hot backup (leaving aside actual backups).
Fifth, while we are doing massive amount of work, it is all building on top of our previous work, and Voron, for example, is live in production for several years now. That gave us a lot of insight into actual usage and behavior patterns.
Sixth, the file format is intentionally designed to be crawlable. That is, if there is an issue (we intend it for hardware failures, but it also cover this scenario), you can scan through the file and find all your records and recover them.
Comment preview