Measuring baseline costs
You might have noticed the low level work I have been posting about lately. This is part of a larger effort to better control over our environment, and hopefully gain more than mere incremental performance improvement.
As part of that, we decided to restructure a lot of our core dependencies. The data format change is one such example, but there are others. Of particular relevance to this post is the webserver and web stack that we use, as well as the actual programming model.
In order to reduce, as much as possible, dependencies on everything else, I decided that I want to benchmark a truly complex part of RavenDB, the “/build/version” endpoint. As you can imagine, this endpoint simply reports the RavenDB version.
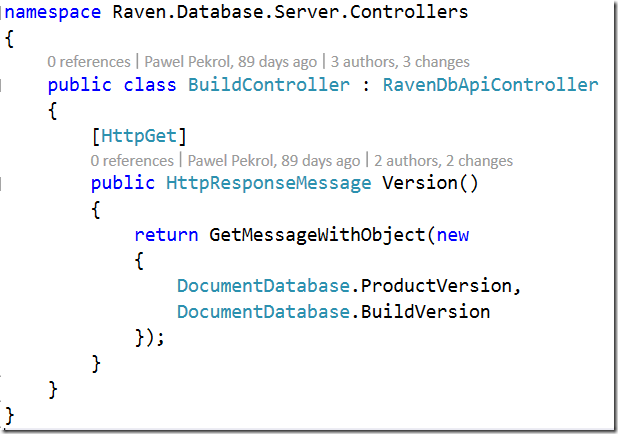
Here is how it looks like in RavenDB 3.0:
This is WebAPI controller, running on OWIN using HttpListener. The methods calls you see here are static (cached) properties, which generate an anonymous object that gets serialized to JSON.
In order to test this, I decided to use gobench to see what kind of functionality I show expect. I run the following command:
- .\gobench.exe -c 100 -r 5000 -u http://localhost:8080/build/version
Here is what this looked like when I run this:
The CPU usage was roughly 70% – 80% by RavenDB, and the rest was taken by gobench. Here are the results:
Requests:                          500,000 hits
Successful requests:               500,000 hits
Network failed:                          0 hits
Bad requests failed (!2xx):              0 hits
Successful requests rate:           15,151 hits/sec
Read throughput:                 4,030,304 bytes/sec
Write throughput:                1,500,000 bytes/sec
Test time:                              33 sec
Remember, we don’t do any real work here, no I/O, no computation, nothing much at all.
Nevertheless, this is quite a nice number, even if it is effectively a hello world. This is with a 100 clients doing 5,000 requests each. Admittedly, this in on the local machine (we’ll do remote testing later), but quite nice.
How about our new code? How does it compare?
Requests:                          500,000 hits
Successful requests:               500,000 hits
Network failed:                          0 hits
Bad requests failed (!2xx):              0 hits
Successful requests rate:           12,500 hits/sec
Read throughput:                 2,312,500 bytes/sec
Write throughput:                1,237,500 bytes/sec
Test time:                              40 sec
So we are a bit slower, although not by much. That is nice, to start with. And here are the process stats while this is running.
You might think that I’m disappointed, but quite the reverse is true. You see, this benchmark results that you are seeing.
They were taken while running under a profiler.
In other words, we saddled ourselves with a huge performance hit, and we are still within touching distance.
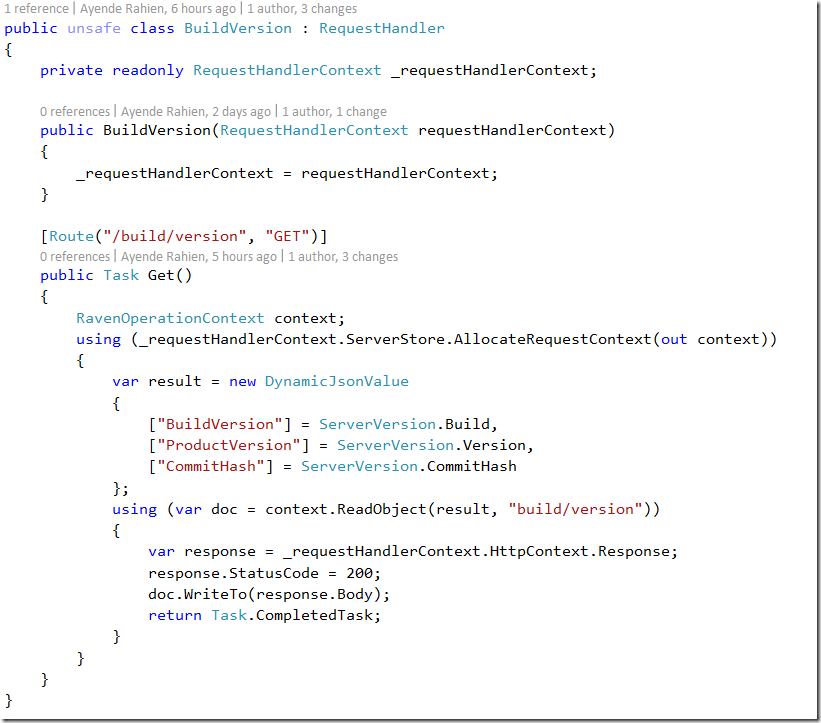
You might have noticed that the process shown here is dnx.exe. This is us running on CoreCLR with the Kesterl web server, and without any web framwork (such as WebAPI). The code we are running here is here:
As you can see, there is quite a bit more code here than in the previous code snippet. This is mostly because we are still playing with the API. We’ll probably have something like the GetObject method once we decide exactly on how to do it. For now, we want to have everything in our face, because it simplify how we are doing things.
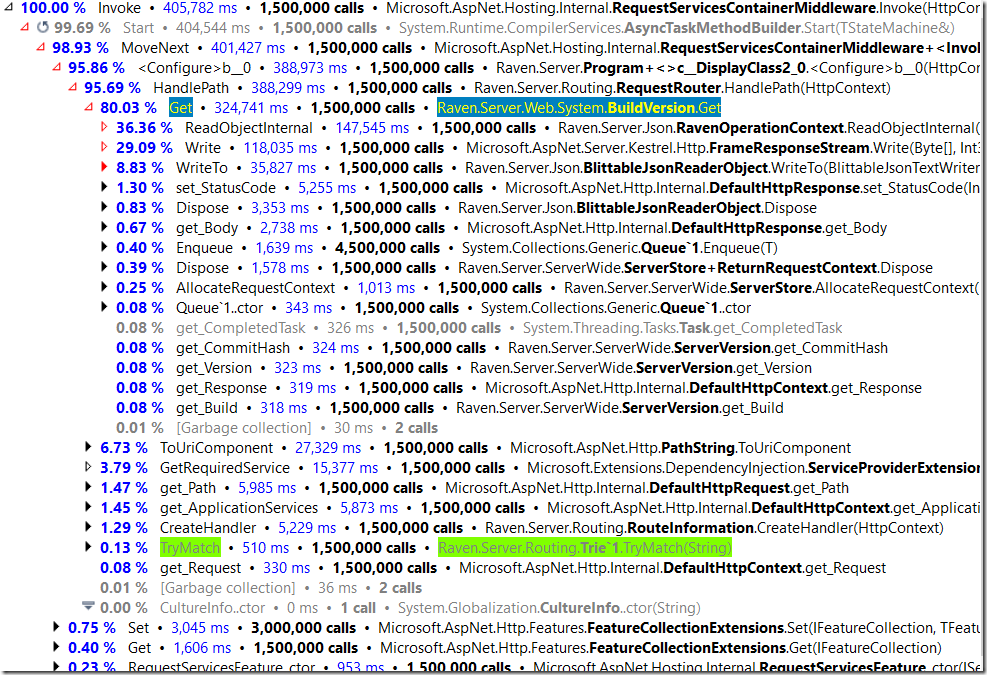
Anyway, I mentioned that I was running this under a profiler, right? Actually, I run this under a profiler while I run the previous command 3 times. Here are the relevant results:
I highlighted a couple of interesting results. The call to BuildVersion.Get took 0.2ms (while under the profiler) and most of the time was spent in serializing the result into JSON (in the profiler output, ReadObjectInternal and Write/WriteTo methods).
Another interesting to note is the TryMatch call. this is how we handle routing. I’ll have a seaprate post on that, but for now, those are pretty encouraging results.
One thing that I do have to say is that the new code is not doing a lot of things that the existing codebase is doing. For example, we keep track on a lot of stuff (requests, durations, etc) that can affect request timing. So it isn’t fair to just compare the numbers. Let us inspect how our existing codebase handle the load under the same profiling scenario.
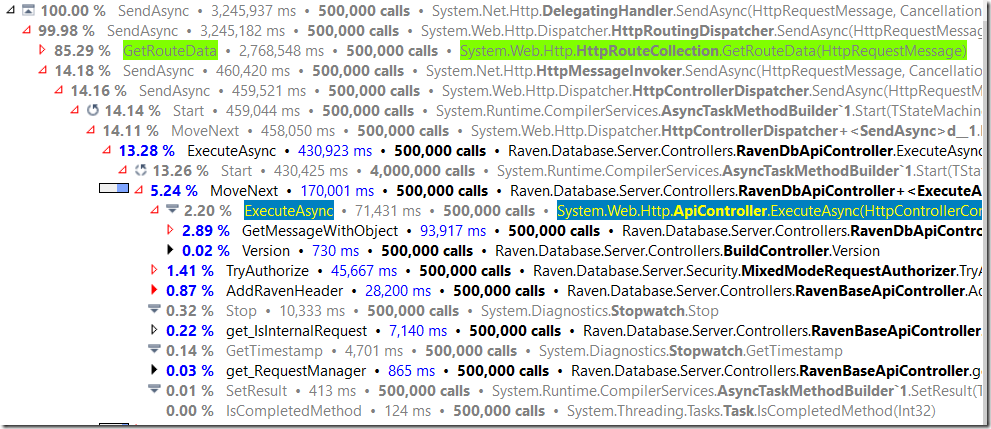
This time I run it only once, so we have only 500,000 requests to look at:
The most obvious think to see here is the request duration. A request takes roughly 6ms under the profiler. While it takes 0.2ms in the new code (still under profiler). The routing code is expensive, but I’ll talk about this in another post. And you can see some of the other stuff that we do that the new code doesn’t (autorization, etc).
Oh, and here are the actual results:
Requests:                          500,000 hits
Successful requests:               500,000 hits
Network failed:                          0 hits
Bad requests failed (!2xx):              0 hits
Successful requests rate:            1,577 hits/sec
Read throughput:                   419,563 bytes/sec
Write throughput:                  156,151 bytes/sec
Test time:                             317 sec
That is quite a change.
Oh, and what about running the new code without a profiler? I have done so, and here is what we see:
And the actual numbers are:
Requests:                        1,500,000 hits
Successful requests:             1,500,000 hits
Network failed:                          0 hits
Bad requests failed (!2xx):              0 hits
Successful requests rate:           75,000 hits/sec
Read throughput:                13,875,000 bytes/sec
Write throughput:                7,425,000 bytes/sec
Test time:                              20 sec
So we actually have capactity to spare here. I’m pretty happy with the results for now![]() .
.


Comments
the new Core framework is much lighter and faster. see this tweet -
https://twitter.com/DamianEdwards/status/679750255772958720.
its fantastic news you're moving for lighter stack, this puts ravendb in the big enterprise players.
for the long run, I think ravendb should completely migrate to coreclr, (this will take some time to port lucene 4.8 and other dependencies from msft), the direction is great!
Uri,
Yes, we intend to move fully to the CoreCLR.
Lucene 4.8 isn't complete, but we are looking into contributing to it to push it forward.
The good news is that for now, Lucene 3.0.3 (the current version of Lucene that we use) seems to be pretty easy to move to the CoreCLR.
Hi Ayende. Why BuildVersion class is unsafe?
Omoi,
It is dealing with memory natively, to write it directly to the network
What happens when you run on kestrel with webapi?
João,
I didn't test that. I'll do such a test later.
Any chance to publish this app anywhere, please? Don't have Go installed.
Alexander,
The app I'm testing is RavenDB.
More specifically, branches master and v4.0
Yes, I understand :) I meant gobench as exe (rather than its source code at https://github.com/cmpxchg16/gobench).
Alexander ,
Oh, just install go, it is pretty easy to do.
Sharing exe is not a good idea in general
Comment preview