Fruits of the poisonous tree: Voron performance refactoring
Earlier this month I posted our results for the initial performance of Voron. We learned a lot from that, and it led us to do some major refactoring to the codebase. Now, we are back on a more or less stable ground, so it is time to actually see what is going on. Where before we had a baseline against other storage engines, now we are testing against the previous version as well as Esent.
To get a good and fixed numbers, I decided to run the tests on a EC2 machine, in particular, an m1.large instance. The idea is that this gives us a simple way to get a standard machine config that anyone can use to test out as well.
For the purpose of this benchmark, we are doing writes to one of the temporary storage disks, rather than a permanent EBS drive. This will presumably be somewhat faster than real world configuration, but I think that running in an environment where we are actually using a common production machine (rather than a dedicated development machine) should give us better numbers, certainly more realistic ones.
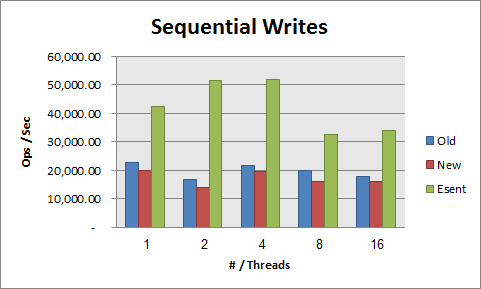
The first thing to check, of course, is the simplest. Sequential writes:
Here we can see that we are actually worse off than we were before. That is actually kind of sad. But we’ll get to that later on.
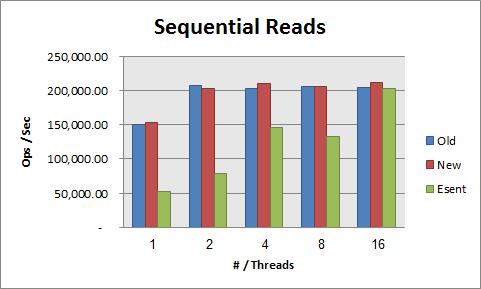
For random reads, we are still very good, and it is obvious that we are pretty early make use of all of the resources that the machine gives us. Here we are consistently slightly faster than the older version, but that is something that is probably accidental. We certainly did no work on improving read performance (there was very little need to do so, after all).
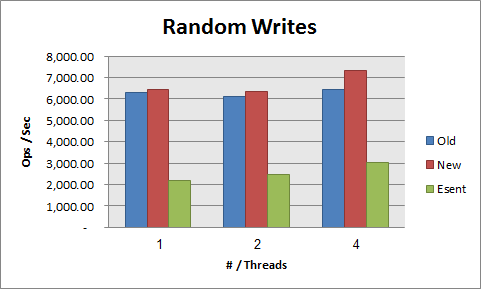
Random writes was a big surprise:
As it happens, it appears that we are faster, significantly so, than Esent in this scenario. Which was quite a surprise. For some reason, we are also faster in the new code than the old version. Which is quite interesting.
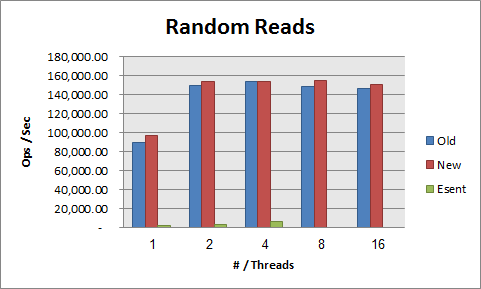
Finally, we have random reads.
No, it isn’t an error. We see a rate of ~1,600 reads/sec for Esent single threaded. I am not quite sure why this is behaving in this fashion, but I am willing to say that there is something wrong and just discount this result.
I mentioned before that it appears that we are actually slower than the old code. So I decided to check what is actually going on there. My tool of choice, the profiler. Here is the old version:
You can see that we have done two runs (one sequential, one random) of 10,000 transactions, writing a total of 2 million items. And roughly 26% of the time is spent committing the transaction.
Digging into that, a lot of that time is spent just flushing to disk:
Note, however, that a decidedly non trivial amount of time is actually spent on ImmutableDictionary, but I’ll touch on that later on.
With our changes, the new code looks like:
The one thing that jumps at me is that the cost of creating a transaction is now very significant. And here is why:
The actual reason for this is likely that we also have the background journal flushing, that now also needs to take the transaction lock. Which is introducing contention into the mix. We’ll need to look into how to resolve that.
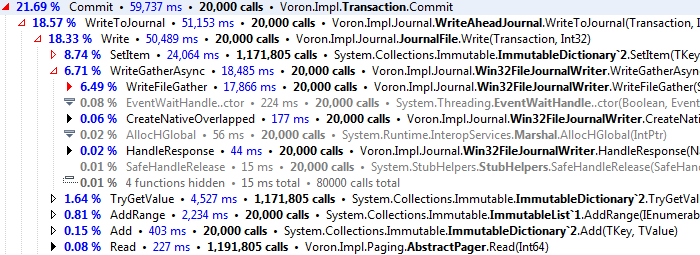
Let us dig into the commit. The change there was pretty much the whole reason for what we were doing.
You can see that we are using WriteFileGather, and unlike before, where syncing took about 15% of the overall time. Now it is taking just 7%. So we are better than 50% improvement on that score.
But the really interesting bit? Look at what was by far the most expensive operation there. It was the calls to immutable dictionary. In fact, let us look at the results in the profiler for the immutable collections:
So now we have two new things that we need to investigate. One is reducing contentions, and the second is checking how we can optimize our usage of the immutable collections.
I’ll report on our finding…






Comments
I read a while back about the LMAX disruptor pattern (http://martinfowler.com/articles/lmax.html). I realize that they are using it to reduce contention at the service level instead of down at the storage level you're working at, however would using an adaptation of the pattern help reduce contention? Since the disruptor doesn't use locking and takes advantage of batching could it be useful in a situation where there is a bottleneck caused by needing collections that support concurrency?
Which profiler do you use?
Interesting. The immutable collections are rather new, so perhaps there are some performance issues that need to be worked out. Looking forward to the next 2 posts to seeing what you found.
Mark,
The problem is that we inherently have mutable global state, the actual data in the db.
Jonathan,
We use dotTrace from JetBrains
Judah,
I am pretty sure that this is pretty basic limitation to the way immutable collection like dictionary have to work.
I have tested the F# code, and it shows the same issue.
Besides less lock contention and better collections, have you considered doing (page size padded) writes of compressed data to the journal?
If I understood correctly, the journal is now basically write-only (except for loading non-data-synced parts of it at startup), with all modified non-data-synced (versions of) pages in scratch memory. So there would no longer be the need for pages stored in the journal to be individually page sized.
There are obviously drawbacks to such an approach, not the least of which is additional (unsafe) code and complexity, as well as the need for either intermediate compression buffer in combination with unbuffered async IO or alternatively performing compression directly to the memmapped journal chunk opened over a write-through file.
Still, using e.g. Snappy or LZ4, I think you might be able to reduce the amount of data to write to the journal by a factor of 2 for small transactions, to possibly a factor of 4 or more for larger transactions and sparsely populated pages.
I don't think this would improve write performance by a factor, but it may reduce time needed for journal writes by something like 20-30% and also reduce disk IO bandwidth competition with the data sync writes.
Alex,
Compressing pages wouldn't actually save us all the much. The way we are actually writing, we have to write full pages, that means that we will only reduce the I/O cost when we need to write data that spans multiple pages. That isn't such a bad idea, but it would means that we would have to have yet another buffer, to hold the compressed data (and revert if it is too big, etc).
It is something to consider, but I don't think it is a mitigating factor for us now.
Are you still using the 75%-25% split strategy, for when the inserted key is greater than the greatest key in the page?
I think this strategy is slowing down the sequential insert scenario. Why not just to not to split the page allocate a new page and insert there the new key?
Jesus,
No, for sequential inserts, we just create a new page.
Comment preview