How do they DO this?
As mentioned, we are doing some more performance work in Voron. And we got some really surprising results there. Voron is writing at really good rate, (better than anything else we tested against), just not a good enough rate.
To be fair, if we haven’t seen the Esent benchmark with close to 750k writes / second, we might have been happy, but obviously it is possible to be much faster than we are now. So I decided to figure it out.
To start with, I run Voron through a profiler, and verified that the actual cost there was purely in calling FlushFileBuffers (the Windows version to fsync). In fact, in our tests, about 75% of the time was spent just calling this function. The test in questions does 1 million inserts, using 10,000 transactions of 100 items each. But Esent can basically do so many it doesn’t even count. So how do they do that?
I’m going to dedicate this post to discussing the process for finding it out, then spend the next one or two discussing the implications. At this level, we can’t really use something like a profiler to figure out what is wrong, we need a more dedicated tool. And in this case, we are talking about Process Monitor. It gives you the ability to see what system calls are being made on your system.
Here is what it looks like when we are committing a transaction with Voron:
And here is what it looks like when we are committing a transaction with Esent:
I was curious to test SQL Server too, and here is what it looks like when SQL Server is committing a transaction:
And if I’m already doing this, here is SQL CE transaction commit:
No, this isn’t a mistake. It didn’t do anything. By default, SQL CE only flushes to memory. You have to force it to flush to disk my using tx.Commit(CommitMode.Immediate); If you do that, the transaction commits looks like this:
Not a mistake, you still get nothing. It appears that even with Immediate, it is only writing to disk when it feels like it. At a guess, it is using memory mapped files and doing FlushViewOfFile, instead of calling FlushFileBuffers, but I am not really sure.
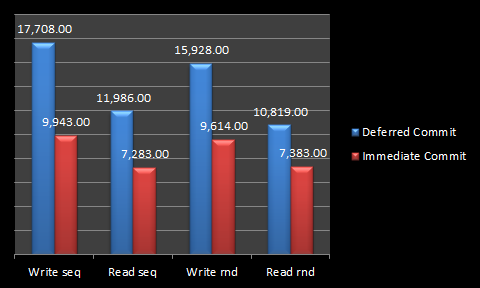
Since I run the benchmarks without immediate, I decided to try running the SQL CE stuff there again. Here are the numbers:
This brings to mind an interesting questions, what the hell is it doing that takes so long if it doesn’t even flush to disk?
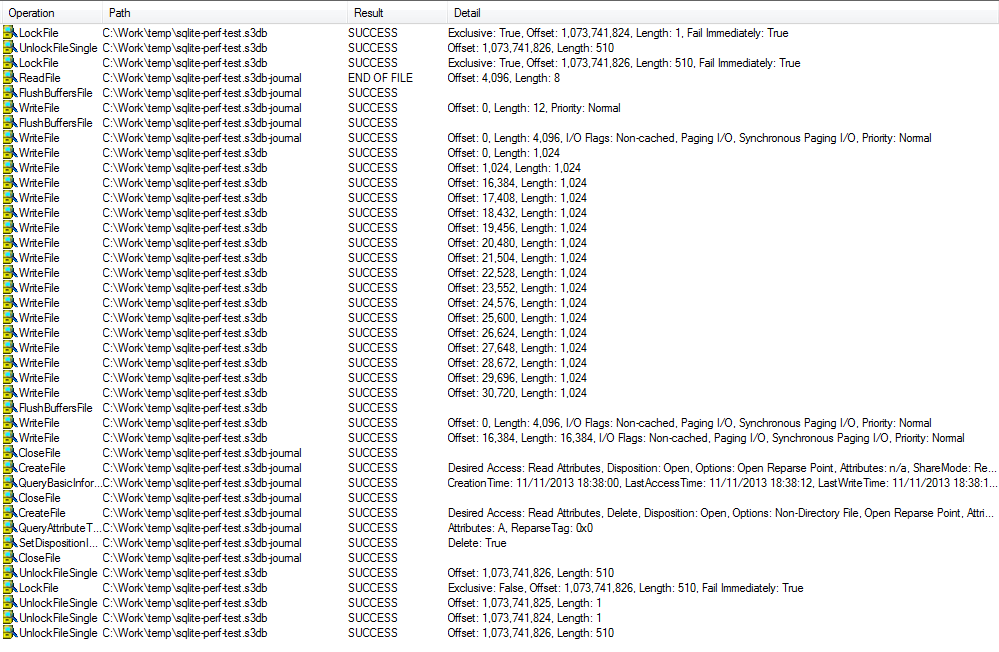
Anyway, let us look at the SQLite version:
And… I don’t really know how to comment on that, to tell you the truth. I can’t figure out what it is doing, and I probably don’t really want to.
Now, let us look at LMDB:
I am not really sure how to explain the amount of work done here. I think that work because it uses manual file I/O. When I use the WriteMap option, I get:
Which is more reasonable and expected.
I would have shown leveldb as well, but I can’t run it on Windows.
I think that this is enough for now. I’ll discuss the implications of the difference in behavior in my next post. In the meantime, I would love to know what you think about this.


Comments
Interesting comparison!!
And I am a little bit in chock that SQL CE does not seem to guarantee durability, even though CommitMode.Immediate is specified - my understanding is that that is precisely what CommitMode.Immediate is for!
You're using FlushFileBuffers and they're using WRITE_THROUGH flag. Why the difference?
@Rafal, Basically no strategy (even in combination with disabling disk write caching) is guaranteed to be safe on any given system. It appears to depend on (non-public) specs what a specific disk subsystem will actually do with the instructions it receives. It is therefore all about minimizing risk at a certain cost.
FlushFileBuffers/IRP_MJ_FLUSH_BUFFERS appears to be safer, as it is supposed to be honored by most devices.
WriteThrough/ForceUnitAccess may be not supported/silently ignored on non SCSI devices, but when it is honored by the device generally is faster than FlushFileBuffers.
A few good reads:
http://winntfs.com/2012/11/29/windows-write-caching-part-2-an-overview-for-application-developers/
http://support.microsoft.com/kb/332023
http://msdn.microsoft.com/en-us/library/windows/hardware/gg463405.aspx
http://research.microsoft.com/pubs/70554/tr-2008-36.pdf
"I can’t figure out what it is doing, and I probably don’t really want to."
Heheh.
Awesome post, and some surprising results indeed. What is SQLite doing? And Sql CE isn't actually flushing to disk - even on immediate? Wow. Wikipedia says,
"SQL CE databases can support ACID-compliance, but do not meet the durability requirement by default because AutoFlush buffers changes in memory (including enlisted ambient transactions and explicit SQL CE transactions that do not override the Commit() call with an CommitMode.Immediate value). Therefore committed transaction changes can be lost. To meet the durability requirement the commit call on the transaction must specify the immediate flag."
It seems, though, even with immediate flag, it's not actually flushing? Either the test is setup wrong, we're measuring the wrong thing, or immediate doesn't work as advertised (in which case, when exactly does it get flushed to disk?)
Rafal,
Those are very different approaches for achieving durability.
In particular, write_through + no_buffering implies a heavily constrained manner of writing to the db (aligned memory, sector size for buffers, etc.)
Judah,
What I think it is doing is setting the next flush time faster.
SQLite's default page size is 1024 bytes. God only knows why they choose such an arbitrary number that actually has no relation to any actual page sizes used by storage devices or operating systems. But if you've ever read the SQLite source code, you'll see it has far worse problems than that.
For LMDB without WriteMap, your trace shows that LMDB writes individual pages (which it does, on Windows) asynchronously. Then it performs a Flush/sync, which apparently is turned into a single long write by the OS. That doesn't seem too unreasonable. The last two writes are updating the meta page; I'm not sure why it shows up as two writes since LMDB only does one. But again, Windows is converting our calls into something else under the covers.
Comment preview