Oren Eini

CEO of RavenDB

a NoSQL Open Source Document Database

Get in touch with me:

oren@ravendb.net +972 52-548-6969

Posts: 7,546
|
Comments: 51,161
Privacy Policy · Terms
filter by tags archive
time to read 3 min | 454 words

I can a lot about the performance of RavenDB, a you might have noticed from this blog. A few years ago we had a major architecture shift that increased our performance by a factor of ten, which was awesome. But with the meal, you get appetite, and we are always looking for better performance.

One of the things we did with RavenDB is build things so we’ll have the seams in place to change the internal behavior without users noticing how things are working behind the scenes. We have used this capability a bunch of time to improve the performance of RavenDB. This post if about one such scenario that we recently implemented and will go into RavenDB 5.0.

Consider the following query:

image

As you can see, we are doing a range based query on a date field. Now, the source collection in this case has just over 5.9 million entries and there are a lot of unique elements in the specified range. Let’s consider how RavenDB will handle this query in version 4.2:

  • First, find all the unique CreatedAt values between those ranges (there can be tens to hundreds of thousands).
  • Then, for each one of those unique values, find all the match documents (usually, only one).

This is expensive and the problem almost always shows up when doing date range queries over non trivial ranges because that combine the two elements of many unique terms and very few results per term.

The general recommendation was to avoid running the query above and instead use:

image

This allows RavenDB to use a different method for range query, based on numeric values, not distinct string values. The performance different is huge.

But the second query is ugly and far less readable. I don’t like such a solution, even if it can serve as a temporary workaround. Because of that, we implemented a better system in RavenDB 5.0. Behind the scenes, RavenDB now translate the first query into the second one. You don’t have to do anything to make it happen (when migrating from 4.2 instances, you’ll need to reset the index to get this behavior). You just use dates as you would normally expect them to be used and RavenDB will do the right thing and optimize it for you.

To give you a sense of the different in performance, the query above on a data set of 5.9 million records will have the following performance:

  • RavenDB 4.2 - 7,523 ms
  • RavenDB 5.0 –    134 ms

As you can imagine, I’m really happy about this kind of performance boost.

time to read 4 min | 797 words

In my last post, I talked about how to store and query time series data in RavenDB. You can query over the time series data directly, as shown here:

You’ll note that we project a query over a time range for a particular document. We could also query over all documents that match a particular query, of course. One thing to note, however, is that time series queries are done on a per time series basis and each time series belong to a particular document.

In other words, if I want to ask a question about time series data across documents, I can’t just query for it, I need to do some prep work first. This is done to ensure that when you query, we’ll be able to give you the right results, fast.

As a reminder, we have a bunch of nodes that we record metrics of. The metrics so far are:

  • Storage – [ Number of objects, Total size used, Total storage size].
  • Network – [Total bytes in, Total bytes out]

We record these metrics for each node at regular intervals. The query above can give us space utilization over time in a particular node, but there are other questions that we would like to ask. For example, given an upload request, we want to find the node with the most free space. Note that we record the total size used and the total storage available only as time series metrics. So how are we going to be able to query on it? The answer is that we’ll use indexes. In particular, a map/reduce index, like the following:

This deserve some explanation, I think. Usually in RavenDB, the source of an index is a docs.[Collection], such as docs.Users. In this case, we are using a timeseries index, so the source is timeseries.[Collection].[TimeSeries]. In this case, we operate over the Storage timeseries on the Nodes collection.

When we create an index over a timeseries, we are exposed to some internal structural details. Each timestamp in a timeseries isn’t stored independently. That would be incredibly wasteful to do. Instead, we store timeseries together in segments. The details about how and why we do that don’t really matter, but what does matter is that when you create an index over timeseries, you’ll be indexing the segment as a whole. You can see how the map access the Entries collection on the segment, getting the last one (the most recent) and output it.

The other thing that is worth noticing in the map portion of the index is that we operate on the values of the time stamp. In this case, Values[2] is the total amount of storage available and Values[1] is the size used. The reduce portion of the index, on the other hand, is identical to any other map/reduce index in RavenDB.

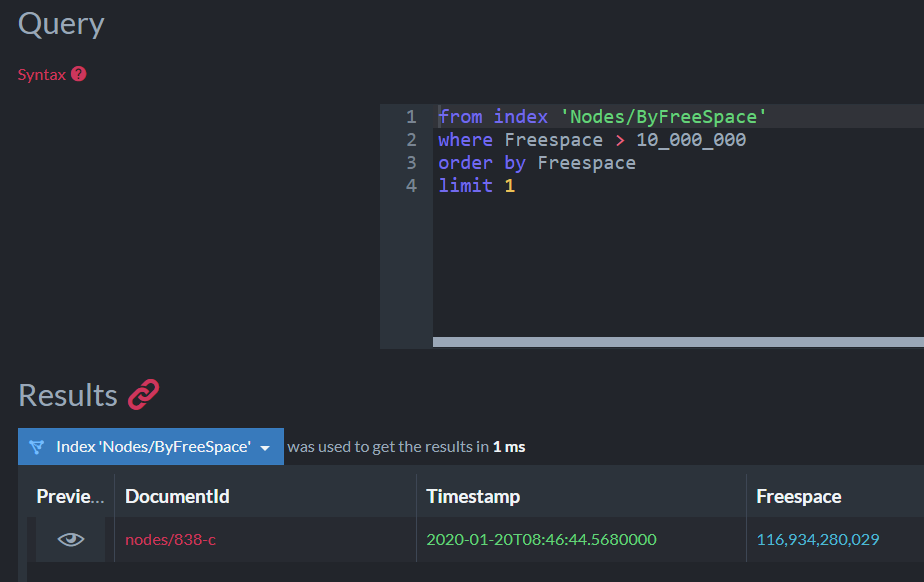
What this index does, essentially, is tell us what is the most up to date free space that we have for each particular node. As for querying it, let’s see how that works, shall we?

image

Here we are asking for the node with the least disk space that can contain the data we want to write. This can be reduce fragmentation in the system as a whole, by ensuring that we use the best fit method.

Let’s look at a more complex example of indexing time series data, computing the total network usage for each node on a monthly basis. This is not trivial because we record network utilization on a regular basis, but need to aggregate that over whole months.

Here is the index definition:

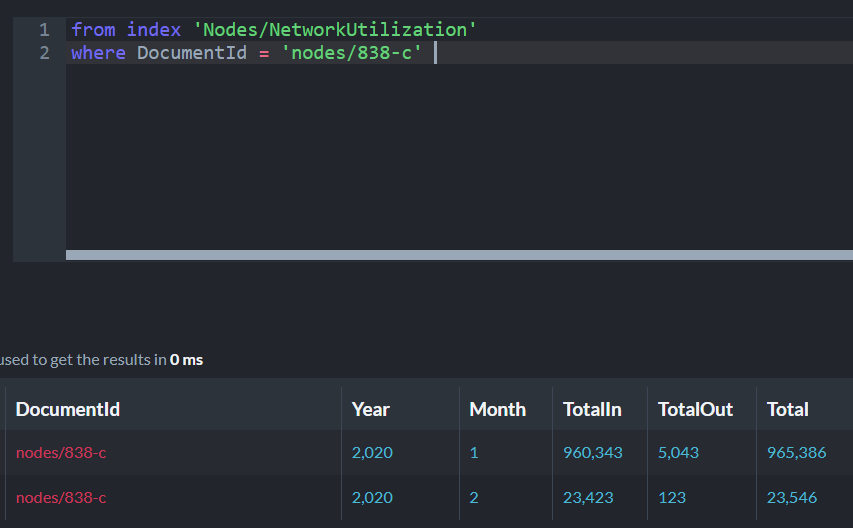
As you can see, the very first thing we do is to aggregate the entries based on their year and month. This is done because a single segment may contain data from multiple months. We then sum up the values for each month and compute the total in the reduce.

image

The nice thing about this feature is that we are able to aggregate large amount of data and benefit from the usual advantages of RavenDB map/reduce indexes. We have already massaged the data to the right shape, so queries on it are fast.

Time series indexes in RavenDB allows us to merge time series data from multiple documents, I could have aggregated the computation above across multiple nodes to get the total per customer, so I’ll know how much to charge them at the end of the month, for example.

I would be happy to know hear about any other scenarios that you can think of for using timeseries in RavenDB, and in particular, what kind of queries you’ll want to do on the data.

time to read 4 min | 633 words

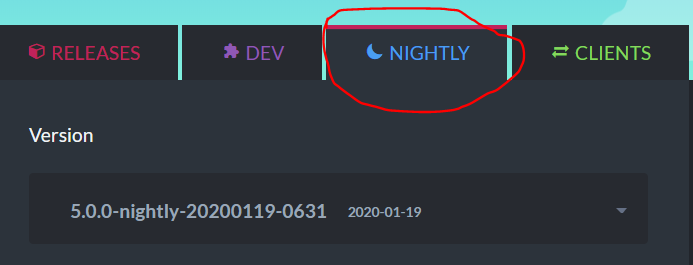
RavenDB 5.0 is coming soon and the big new there is time series support. We have gotten to the point where we can actually show off what we can do, which makes me very happy. You can use the nightlies builds to explore time series support in RavenDB 5.0. Client side packages for 5.0 are also available.

image

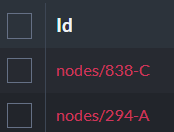
I went ahead and created a new database and created some documents:

image

Time series are often used for monitoring, so I decided to go with the flow and see what kind of information we would want to store there. Here is how we can add some time series data to the documents:

I want to focus on this for a bit, because it is important. A time series in RavenDB has the following details:

  • The timestamp to associate to the values – in the code above, this is the current time (UTC)
  • The tag associated with the timestamp – in the code above, we record what devices and interfaces these measurements belong to.
  • The measurements themselves – RavenDB allows you to record multiple values for a single timestamp. We threat them as an array of values, and you can chose to put them in a single time series or to split them.

Let’s assume that we have quite a few measurements like this and that we want to look at the data. You can explore things in the Studio, like so:

image

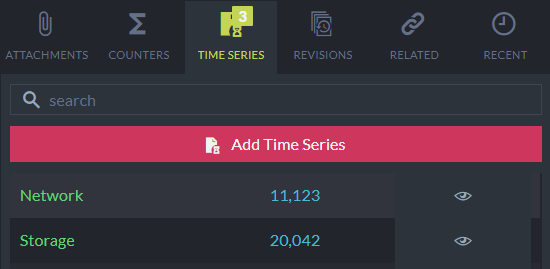
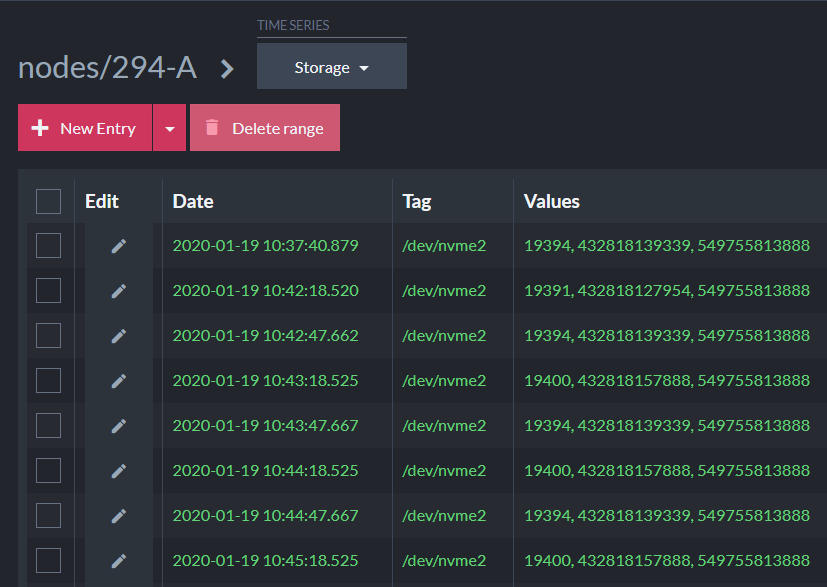
We have another tab in the Studio that you can look at which will give you some high level details about the timeseries for a particular document. We can dig deeper, too, and see the actual values:

image

You can also query the data to see the patterns and not just the individual values:

The output will look like this:

image

And you can click on the eye to get more details in chart form. You can see a little bit of this here, but it is hard to do it justice with a small screen shot:

image

Here is what the data you get back from this query:

The ability to store and process time series data is very important for monitoring, IoT and healthcare systems. RavenDB is able to do quite well in these areas. For example, to aggregate over 11.7 million heartrate details over 6 years at a weekly resolution takes less than 50 ms.

We have tested timeseries that contained over 150 million entries and we can aggregate results back over the entire data set in under three seconds. That is a nice number, but it doesn’t match what dedicated time series databases can do. It represents a rate of about 65 million rows / second. ScyllaDB recently published a benchmark in which they talk about billion rows / sec. But they did that on 83 nodes, so they did just 12 million / sec per node. Less than a fifth of RavenDB’s speed.

But that is being unfair, to be honest. While timeseries queries are really interesting, we don’t really expect users to query very large amount of data using raw queries. That is what we have indexes for, after all. I’m going to talk about this in depth in my next post.

FUTURE POSTS

  1. Partial writes, IO_Uring and safety - about one day from now
  2. Configuration values & Escape hatches - 5 days from now
  3. What happens when a sparse file allocation fails? - 7 days from now
  4. NTFS has an emergency stash of disk space - 9 days from now
  5. Challenge: Giving file system developer ulcer - 12 days from now

And 4 more posts are pending...

There are posts all the way to Feb 17, 2025

RECENT SERIES

  1. Challenge (77):
    20 Jan 2025 - What does this code do?
  2. Answer (13):
    22 Jan 2025 - What does this code do?
  3. Production post-mortem (2):
    17 Jan 2025 - Inspecting ourselves to death
  4. Performance discovery (2):
    10 Jan 2025 - IOPS vs. IOPS
View all series

Syndication

Main feed Feed Stats
Comments feed   Comments Feed Stats
}